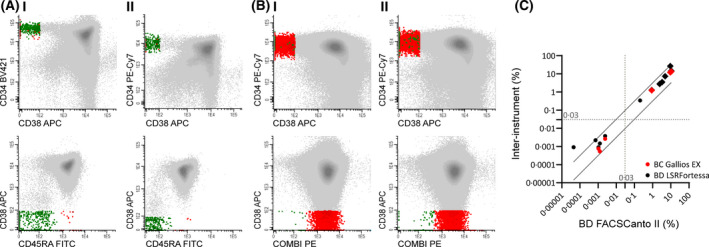
Fig. 2.

Central site inter‐instrument processing. Multiple samples with similar processing were measured across multiple flow cytometric instruments (A) or platforms (B). (A) Training sample 1 was measured on BD FACSCanto II (I) and BD LSRFortessa (II). FACS plots of complete blasts (top row) and CD34+ blasts (bottom row). CD33 and CD34 were exchanged in the channel (see Table S3) for standardisation within the coordinating institute. (B) A diagnostic AML sample was measured on BD FACSCanto II (I) and BC Gallios EX (II). FACS plots for complete blast population (top row) and CD34+ blast population (bottom row). (C) LSC percentages (dots) and lymphocyte percentages (diamonds) analysed in samples measured on BD LSRFortessa (black) and BC Gallios EX (red), compared to BD FACSCanto II. 0·5 log error is depicted as diagonal lines. 0·03% clinical stem cell cut‐off depicted as dotted lines. Pearson correlation coefficients between BC Gallios EX and BD FACSCanto II, and BD LSRFortessa and BD FACSCanto II were r = 1·00, P =< 0·001 and r = 0·91, P =< 0·0001 respectively. Grey: (CD34+) population; Red: LSC; Green: HSC.
