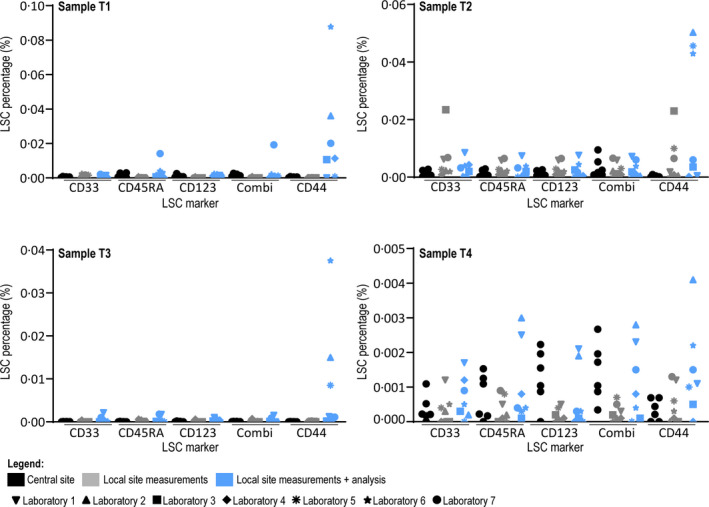
Fig. 3.

Results of central site and local sites on initial samples. Results of analysis of FCS files generated at central site by six researchers from central site (black), results of FCS files generated at local sites with analysis by one researcher from central site (grey) and results of FCS files generated at local sites with analysis from local site (blue) on samples T1–T4. All individual results are shown as the percentage of leukaemic stem cells of the complete white blood cell compartment. Laboratories are specified using different symbols, showing that differences in LSC percentages is not consistently explained by one laboratory. Axes run from 0·000% to 0·030% (clinical relevant cut‐off) for sample T1 and T2, and 0·000–0·003% for samples T3 and T4. CD44 is not depicted due to high variance (shown in Figure S3).
