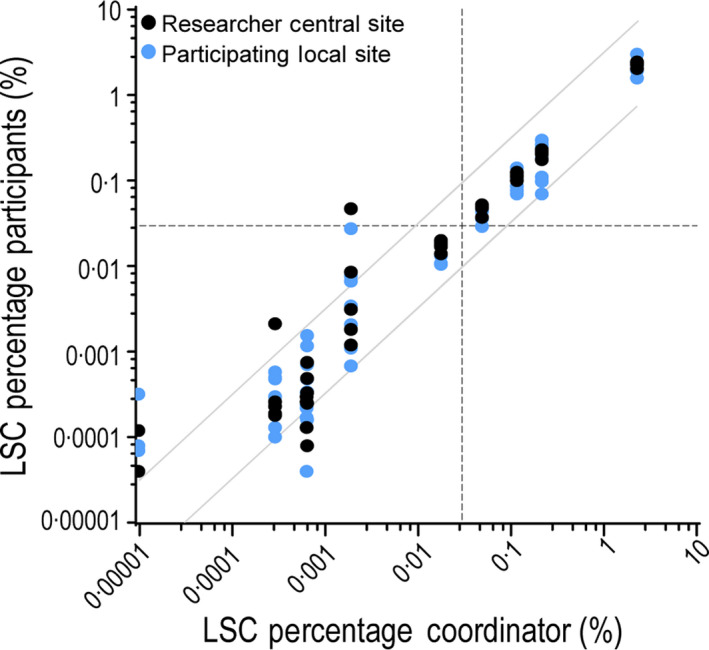
Fig. 4.

Results of central site and local sites on validation FCS files. Ten representative diagnostic AML samples were selected and corresponding flow cytometry files were sent to six researchers from the central site and seven participating centres for analysis. Results were reported back as the leukaemic stem cell percentage analysed by the most reliable stem cell marker (or markers). Results reported by one researcher from the central site compared to LSC percentages reported by all other participants (researchers from the central site in black, participating laboratories in blue). Previously determined (and validated) cut‐off of 0·03% is shown as a dotted line. Results above the clinical validated cut‐off fall within ±0·5 log error, shown as grey diagonal lines. Lower percentages fall outside ±0·5 log error but are clinically irrelevant.
