FIGURE 3.

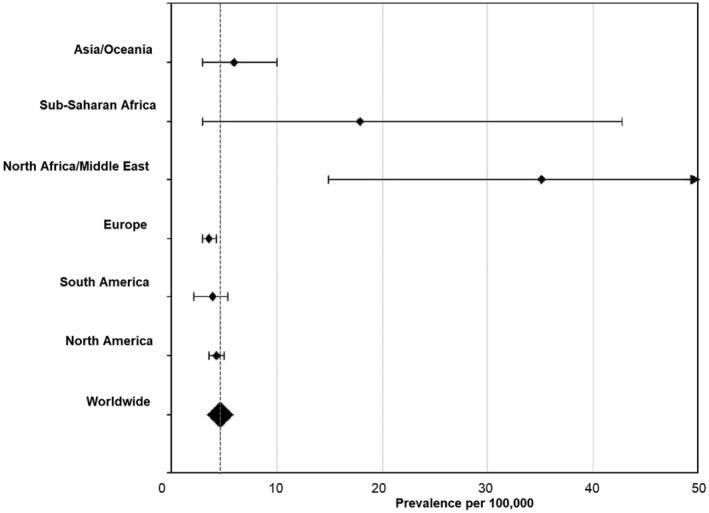
Forest plot of achondroplasia pooled birth prevalence estimates. Prevalence was estimated using the quality effects model

Forest plot of achondroplasia pooled birth prevalence estimates. Prevalence was estimated using the quality effects model