
FIGURE 1.
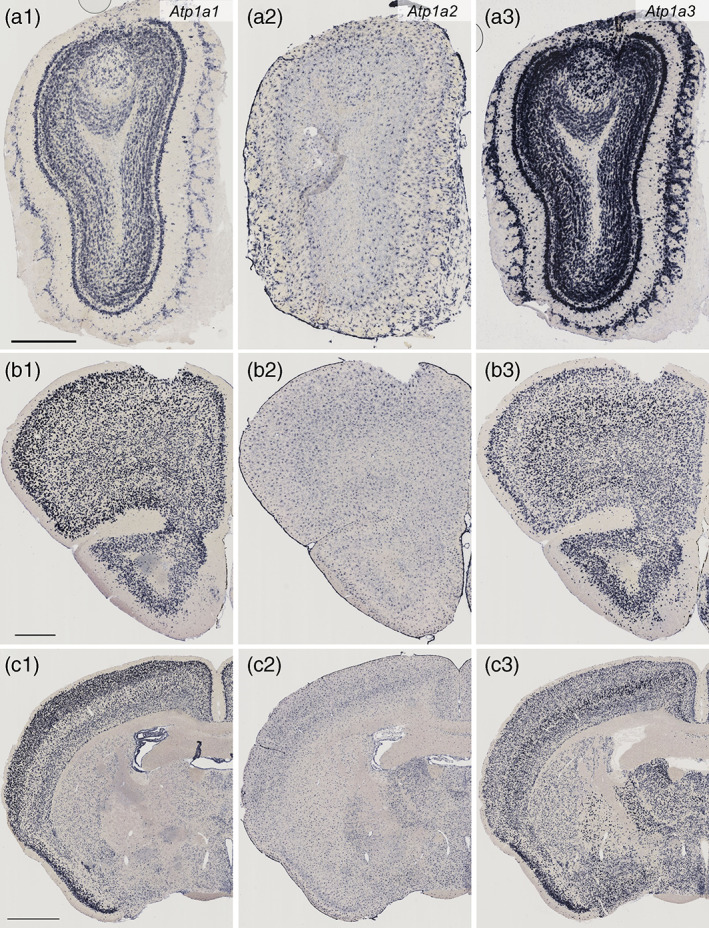
Distribution of Atp1a1, Atp1a2, and Atp1a3 mRNAs in the mouse brain as revealed by in situ hybridization (Part 1, low magnification). Coronal mouse brain sections are shown. All sections through Figures 1, 2, 3, 4 were obtained from one mouse and stained in the same procedure to minimize the difference of signal intensity due to variations in experimental conditions. Atp1a1 mRNA (a1, b1, and c1), Atp1a2 mRNA (a2, b2, and c2), and Atp1a3 mRNA (a3, b3, and c3). The olfactory bulb (a1–a), the frontal cortex (b1–b3), and the striatum, globus pallidus and piriform cortex (c1–c3). Scale bars: 500 μm in a1 and b1, 1 mm in (c1)