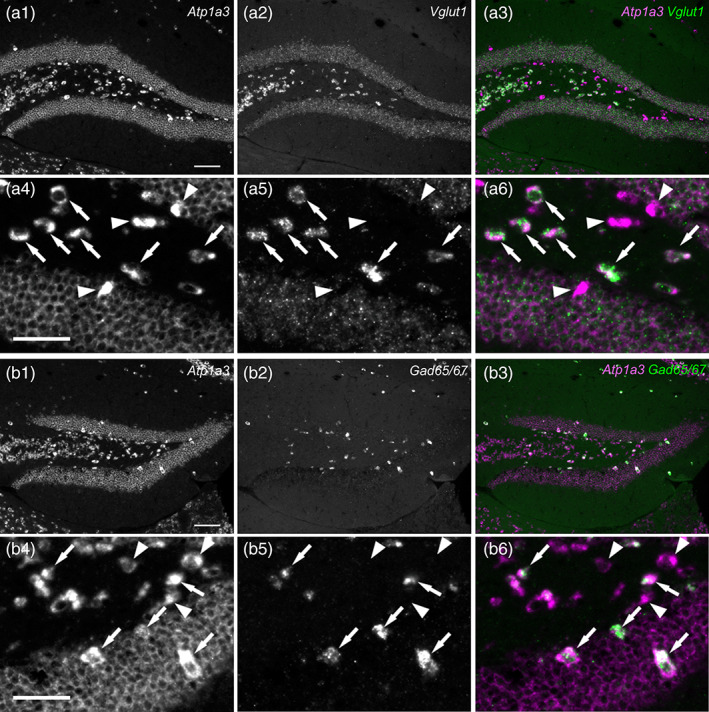
FIGURE 6.

Glutamatergic and GABAergic cells expressing high levels of Atp1a3 mRNA in the mouse DG and hilus. (a) Double fluorescent in situ hybridization for Atp1a3 (a1 and a4) and Vglut1 (a2 and a5) mRNAs in the DG at low magnification (a1–a3), high magnification (a4–a6), and merged views (a3 and a6: magenta, Atp1a3; green, Vglut1). The arrows show Atp1a3(++) and Vglut1(++) cells. The arrowheads show Atp1a3(+) cells. (b) Double fluorescent in situ hybridization for Atp1a3 (b1 and b4) and Gad65/67 (b2 and b5) in the DG at low magnification (b1–b3), high magnification (b4–b6) and merged views (b3 and b6: magenta, Atp1a3; green, Gad65/67). The arrows show Atp1a3(++) and Gad65/67(++) cells. The arrowheads show Atp1a3(+) cells. Scale bars: 100 μm in a1 and b1, 50 μm in a4 and b4
