FIGURE 18.

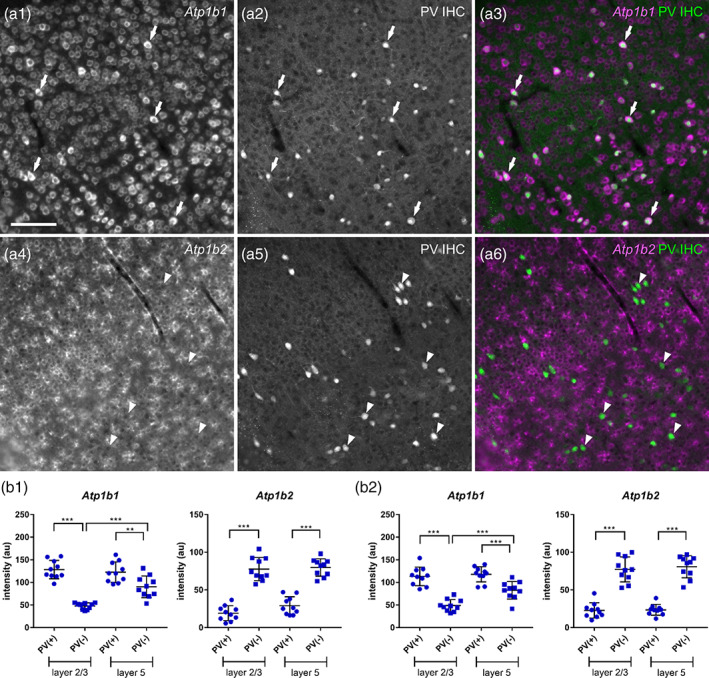
High levels of Atp1b1 expression and low levels of Atp1b2 expression by PV neurons in the somatosensory cortex. (a) Double fluorescent labeling of Atp1b isoform 1 or 2 mRNA (a1 and a4, respectively) and PV protein (a2 and a5), and merged views (a3 and a6: magenta, Atp1b; green, PV) in the somatosensory cortex. Atp1b1 (a1–a3) and Atp1b2 (a4–a6). The arrows show PV(+) Atp1b(+) cells. The arrowheads show PV(+) Atp1b(−) cells. Scale bar: 100 μm. (b) Signal intensities of Atp1b1 and Atp1b2 in a single PV(+) and PV(−) cell in Layers 2/3 and 5. Data represent means ± SD and each dot represents data from a single cell (n = 10 cells). Data of b1 and b2 were obtained from different animals. Statistical significance was calculated using one‐way analysis of variance (ANOVA) with post hoc Tukey's test (n = 10 cells). **, p < .01; ***, p < .001
