
Figure 3.
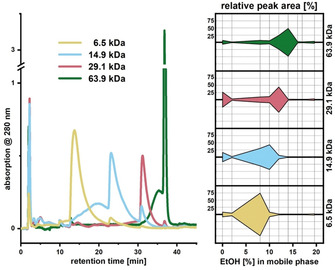
(Left) Normalized chromatograms from analytical HIC fractionation of PSS standards of different sizes. (Right) Comparison of PSS standards in terms of relative peak area versus EtOH content in the mobile phase. Elution was sensitive to M w with lower‐M w standards eluted earlier than higher‐M w ones.