
Figure 9.
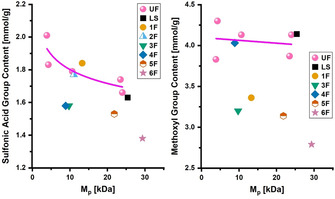
Functional group content versus M p of the collected HIC fractions (1F–6F), the reference sample (LS), and the ultrafiltrated fractions (UF10–UF100). (Left) sulfo groups; (Right) methoxyl groups. UF represents the average content from molecular weight; different contents indicate differences in the chemical composition of the collected fractions.