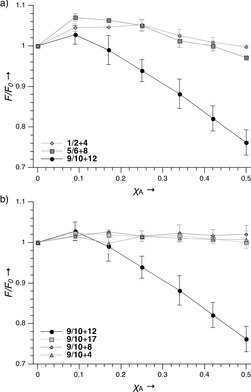
Figure 3.

Relative changes in NBD fluorescence intensity (F/F 0) at 530 nm as a function of increasing molar fraction of the complementary TAMRA‐labeled β‐PNA strands (Χ A). a) The results of all matching combinations and b) of 9/10 with all possible combinations are shown. Measurements were performed at 10 °C in 10 mM Tris⋅HCl buffer at pH 7.5 (number of measurements n=3).
