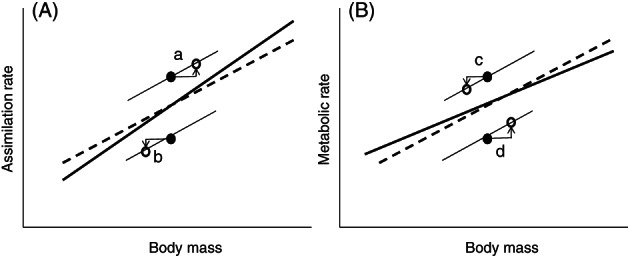
Fig 5.

Schematic explanation of why interspecific scaling should be steeper for assimilation (A) and shallower for metabolic rate (B) than intraspecific scaling. Intraspecific relationships for both species are assumed to be the same for the metabolic rate in A and for the assimilation rate in B, which means that the species with the higher assimilation rate have a higher production in A, while the species with the higher MR have a lower production in B. Dashed lines represent average intraspecific relationships, thin lines represent species‐specific relationships, and thick lines represent the resulting interspecific relationships. Filled circles represent the body size of species before body size optimization, and open circles represent body size after optimization. Because the filled circles lie one above another, their departure from the average is neutral with respect to the interspecific slope. Species a and b have the same parameters that describe the size dependence of metabolic and mortality rates, while species a has a higher rate of resource assimilation. The production rate of species a as well as its optimal size at maturity will be higher. Thus, the data point for species a on a log body size–log assimilation rate plane will be placed higher than that for species b and to the right, whereas species b will be shifted to the left, which reduces the variance caused by the higher/lower assimilation (A). For the assimilation rate, the interspecific slope will be steeper than the average intraspecific slope because the interspecific line is pulled upwards on the right and downwards on the left. If species c and d have the same assimilation and mortality rates but species c has a higher MR than species d, then the production rate of c will be lower than that of d, which will also affect the optimal body size (B), and the interspecific slope will be lower than the average intraspecific slope.
