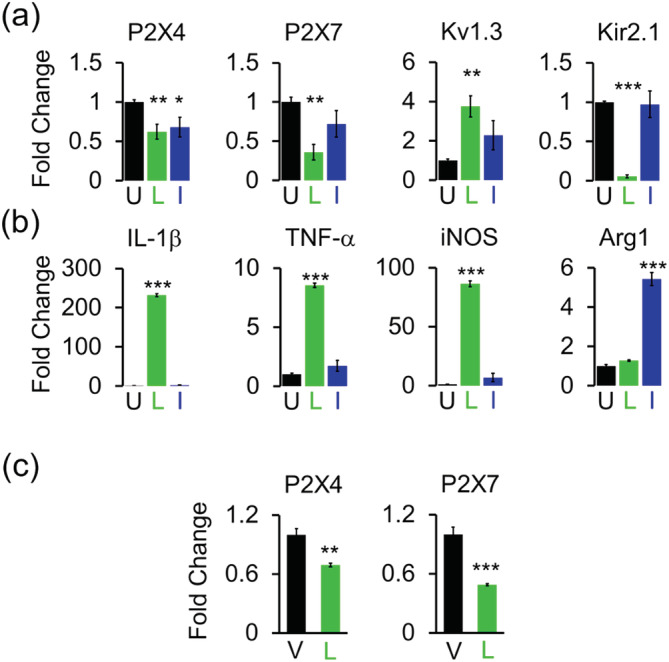
FIGURE 3.

Gene expression changes in differentially activated microglia. Quantitative PCR (qPCR) quantification of mRNA expression of (a) channels and (b) microglia‐associated cytokines and markers in undifferentiated (U), lipopolysaccharides (LPS) (L), and interleukin‐4 (IL‐4) (I) differentiated microglia. Data from three independent mixed‐gender microglia cultures. (c) Quantification of mRNA in acutely isolated CD11b+ microglia from mice receiving intracerebroventricular (ICV)‐PBS vehicle (V; n = 4) and ICV‐LPS (L; n = 4). Bar graphs represent means ± SEM. Statistical analysis was performed using unpaired t test. *p < 0.05, **p < 0.01, and ***p < 0.001 versus undifferentiated or vehicle‐injected microglia [Color figure can be viewed at wileyonlinelibrary.com]
