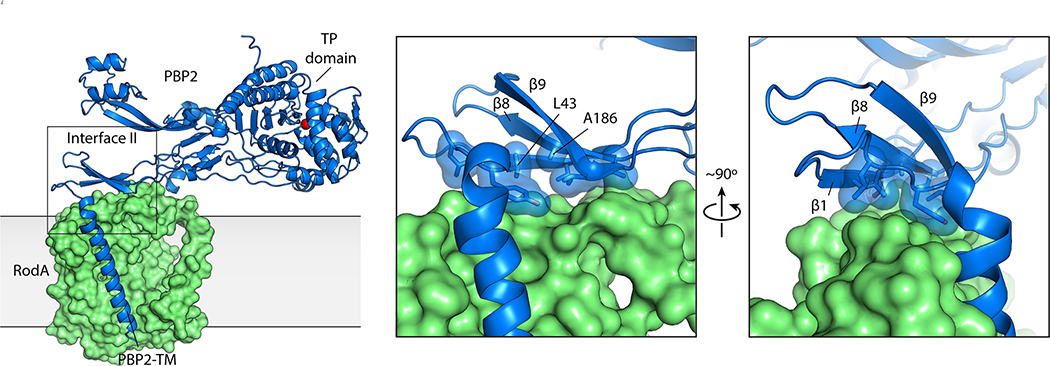
Extended Data Fig. 3: RodA:PBP2 complex interface II.
PBP2 is shown as ribbons colored blue and RodA is shown as molecular surfaces and colored green. The insets show two views of interface II. Side chains of PBP2 residues at the RodA interface are shown as sticks with hydrophobic residues also shown as transparent molecular surface to highlight surface complementarity. Two PBP2 residues that disrupted RodA function when substituted with arginine are labeled.

