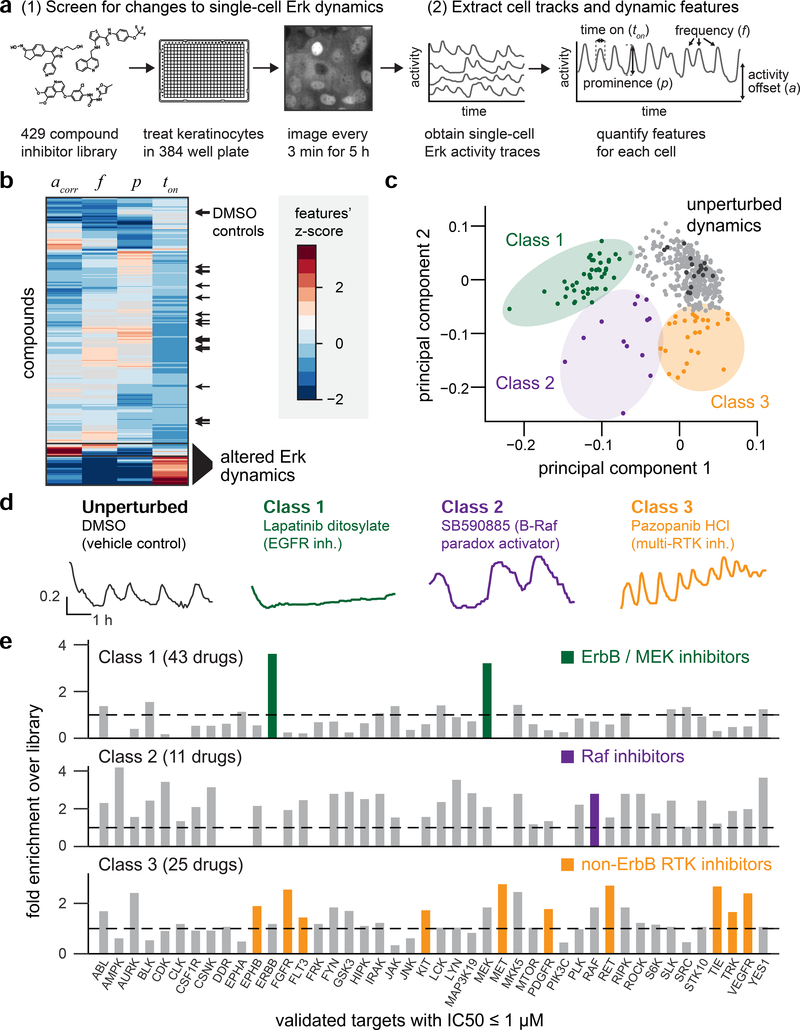
Figure 3. A kinase inhibitor screen for changes in Erk dynamics.
(A) Overview of experimental and computational steps in the small molecule screen. KTR-H2B keratinocytes were plated in 384-well plates, treated with kinase inhibitors, and monitored every 3 min for 5 h. H2B and KTR fluorescence images were used to track cells, assess Erk activity, and extract dynamic features for approximately 200 single cells per well. (B) Hierarchical clustering of all compounds by four dynamic features. Black arrows: DMSO controls from all 9 plates. (C) Principal component analysis showing the contribution of each compound along the first two principal components. Black dots indicate DMSO controls, and three classes of drug-induced perturbations are indicated. (D) Representative single-cell traces of Erk dynamics for one drug from each class. Drug name and the expected molecular target are indicated. (E) Enrichment analysis for drug targets in each class. Enrichment scores represent how many compounds hit a target within a class as compared to the overall compound library. Highlighted bars indicate enriched targets representing specific biological hypotheses for each class.

