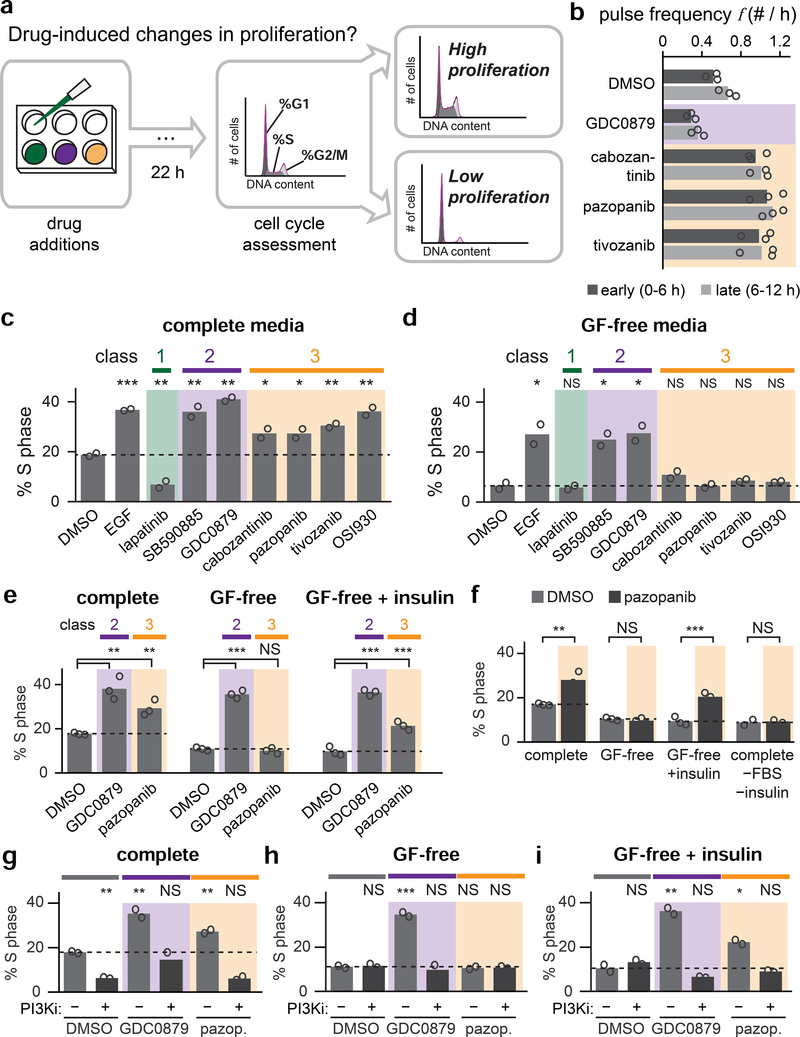
Figure 5. Drugs that alter Erk dynamics have distinct effects on cell proliferation.
(A) Schematic describing assay for cell proliferation in response to drug treatment. Keratinocytes are incubated for 22 h in the presence of a candidate compound and the resulting cell cycle distribution is assessed by flow cytometry. The fraction of S phase cells is taken as a proxy for proliferation. For panels C-I, biological replicates (white circles) were assessed from flow cytometry DNA content distributions of at least 20,000 cells each. Statistics are derived using a one-sided t-test (*, p < 0.05; **, p < 0.01; ***, p < 0.001). (B) Quantification of Erk activity pulse frequency during the first and second halves of 14 h timecourses after stimulation with Class 2 and 3 compounds. Each biological replicate (white circle) represents the mean of least 100 single-cell trajectories. (C-D) Quantification of cell proliferation (as described in A) for keratinocytes treated with compounds from Class 1 (green), Class 2 (purple), or Class 3 (orange), EGF, or DMSO control and cultured in complete media (in C) or GF-free media (in D). (E) Quantification of cell proliferation (as described in A) for keratinocytes treated with GDC0879, pazopanib or DMSO control and cultured in the indicated media. (F) Quantification of cell proliferation (as described in A) for keratinocytes treated with pazopanib or vehicle control in the indicated media. (G-I) Quantification of cell proliferation (as described in A) for keratinocytes treated with GDC0879, pazopanib or DMSO control in the presence or absence of the PI 3-kinase inhibitor pictilisib and cultured in complete media (for G), GF-free media (for H) or GF-free + insulin media (for I).

