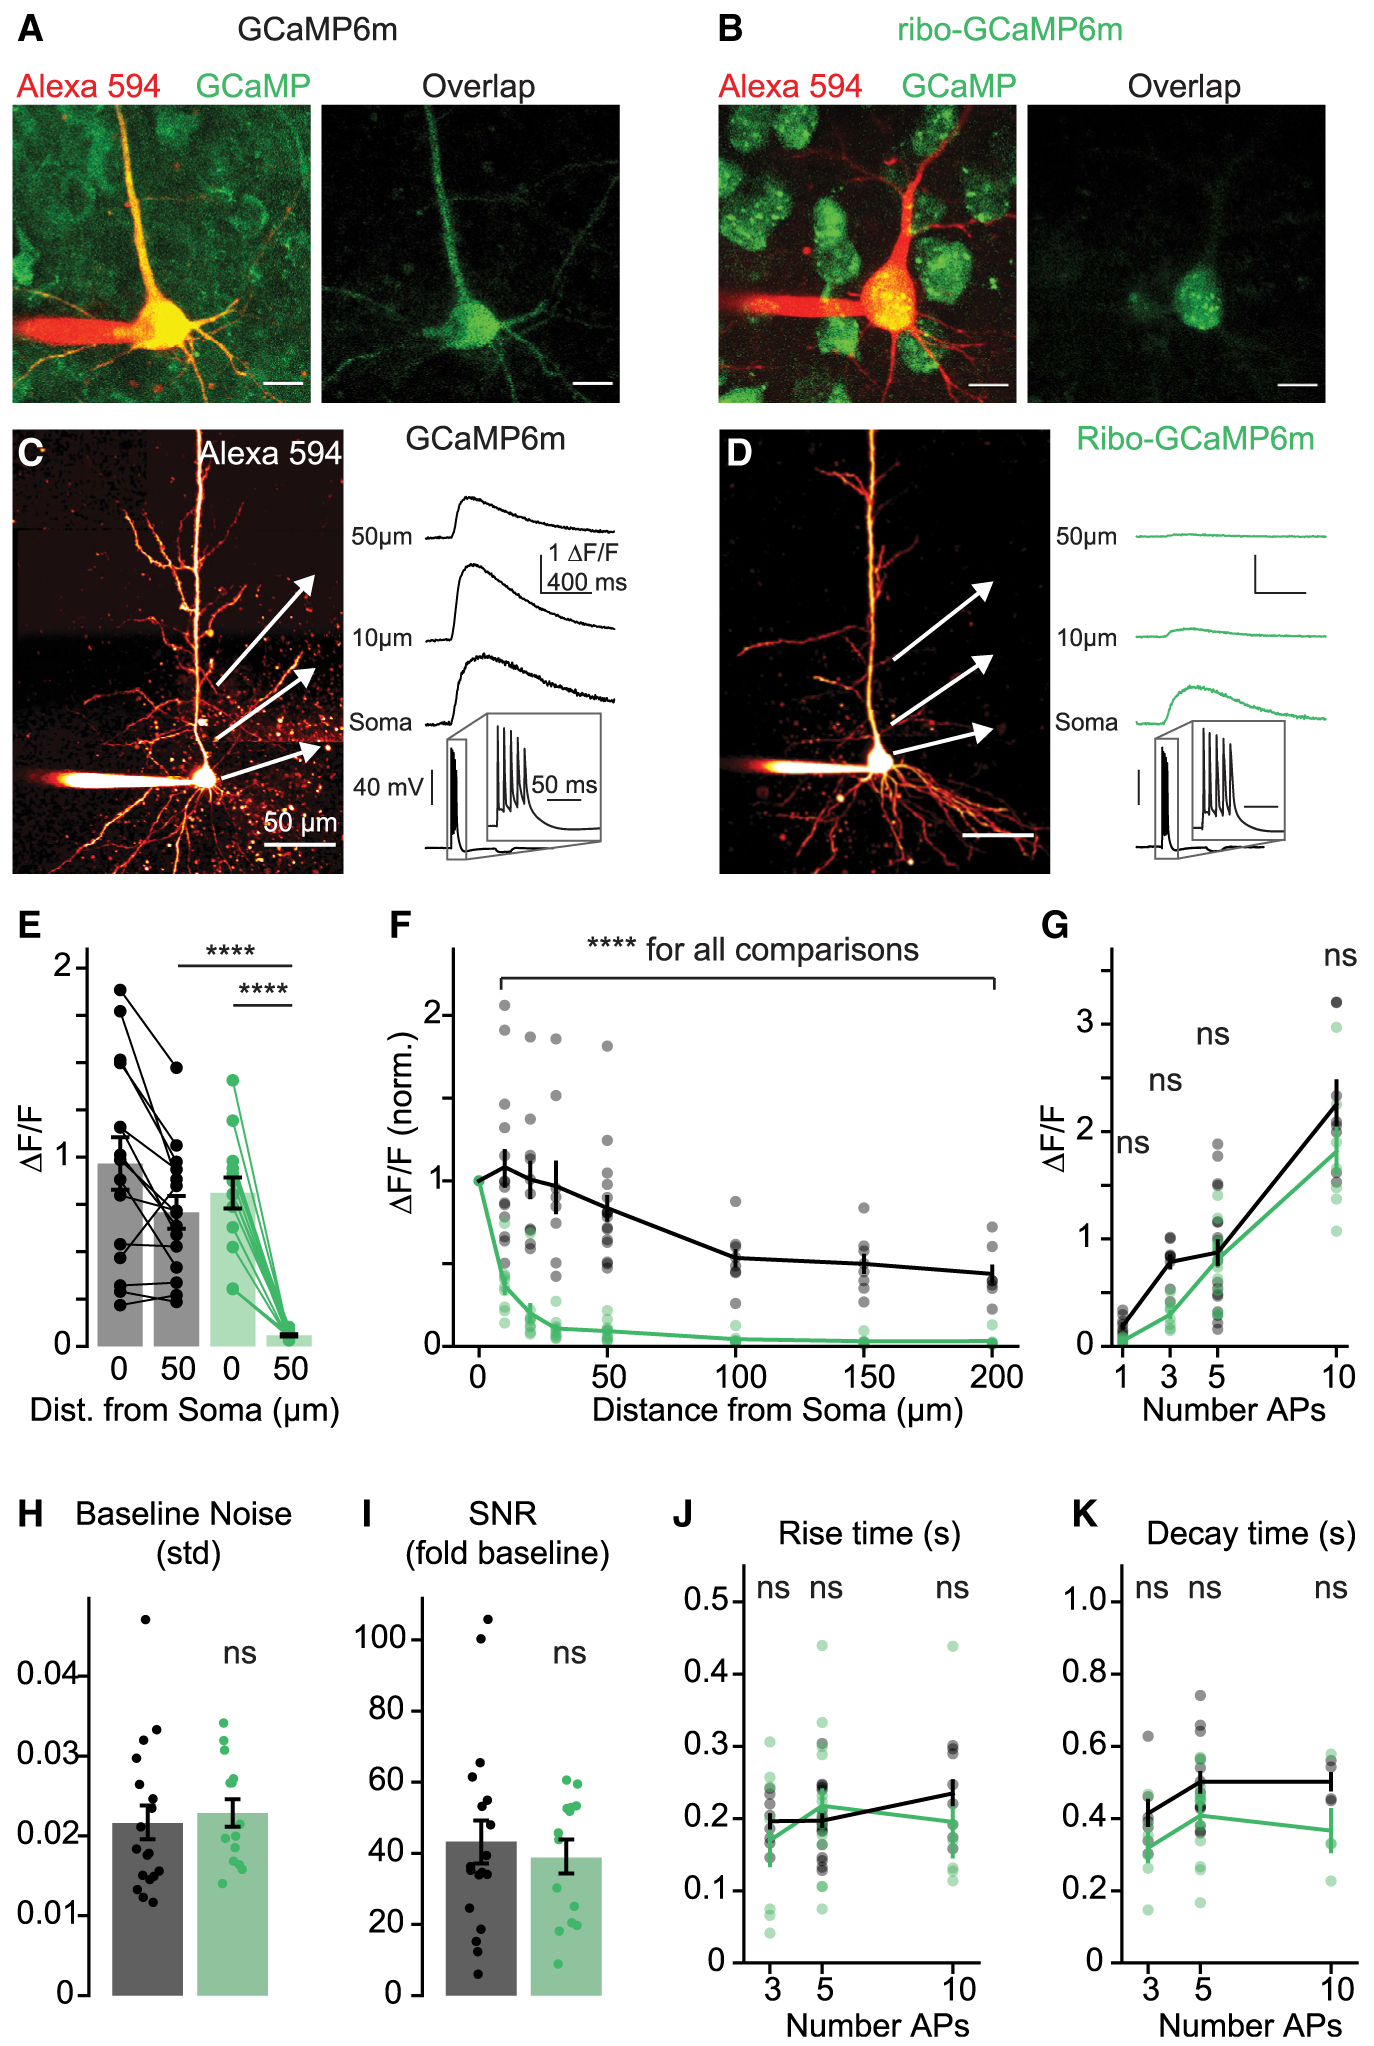
Figure 4. Subcellular Distribution and Kinetics of Ribo-GCaMP.

(A and B) 2P z stacks of layer 5 pyramidal neurons expressing GCaMP6m (A) or ribo-GCaMP6m (B). Left, overlay of Alexa 594 cell fill and and non-calcium-bound GCaMP fluorescence (810 nm imaging wavelength). Right, overlap of Alexa 594 and GCaMP fluorescence. Scale bars are 10 μm.
(C and D) Example 2P line scans of (C) GCaMP6m and (D) ribo-GCaMP6m fluorescence in response to trains of 5 APs (imaging wavelength 920 nm). Example transients are averages of 10 trials. Scale bars are 50 μm.
(E) Response to 5 APs measured at the soma and 50 μm along the apical dendrite for GCaMP6m (n = 15) and ribo-GCaMP6m (n = 14). Bars indicate means ± SEMs, ****p < 0.0001, 1-way ANOVA, Holm-Sidak correction.
(F) Normalized peak fluorescence imaged at varying distances along the apical dendrite in response to 5 APs (10, 20, 30, 50, 100, 150, and 200 μm; normalized to signal at 0 μm) for GCaMP6m (n = 7–15) and ribo-GCaMP6m (n = 6–14). Lines and bars indicate means ± SEMs. ****p < 0.0001 for all comparisons between GCaMP6m and ribo-GCaMP6m, 2-way ANOVA, Holm-Sidak correction.
(G) Response at the soma to 1, 3, 5, and 10 APs of GCaMPm (n = 8–18) and ribo-GCaMP6m (n = 7–14). p = 0.73, 0.06, 0.73, and 0.10 for 1, 3, 5, and 10 APs), 2-way ANOVA, Holm-Sidak correction.
(H) Standard deviation of the baseline fluorescence signal for GCaMP6m (n = 16) and ribo-GCaMP6m (n = 14). p = 0.67, 2-tailed unpaired t test.
(I) Fold increase of somatic fluorescence signal over the standard deviation of the baseline in response to 5 APs for GCaMP6m (n = 16) and ribo-GCaMP6m (n = 14). p = 0.59, 2-tailed unpaired t test.
(J) Time to peak after stimulus offset for GCaMP6m (n = 8–18) and ribo-GCaMP (n = 6–14). p = 0.56, 0.82, and 0.56 for 3, 5, and 10 APs, 2-way ANOVA, Holm-Sidak correction.
(K) Half-maximal decay time for GCaMP6m (n = 4–13) and ribo-GCaMP6m (n = 4–12). p = 0.14, 0.01, and 0.13 for 3, 5, and 10 APs, 2-way ANOVA, Holm-Sidak correction.
See also Figure S2.
