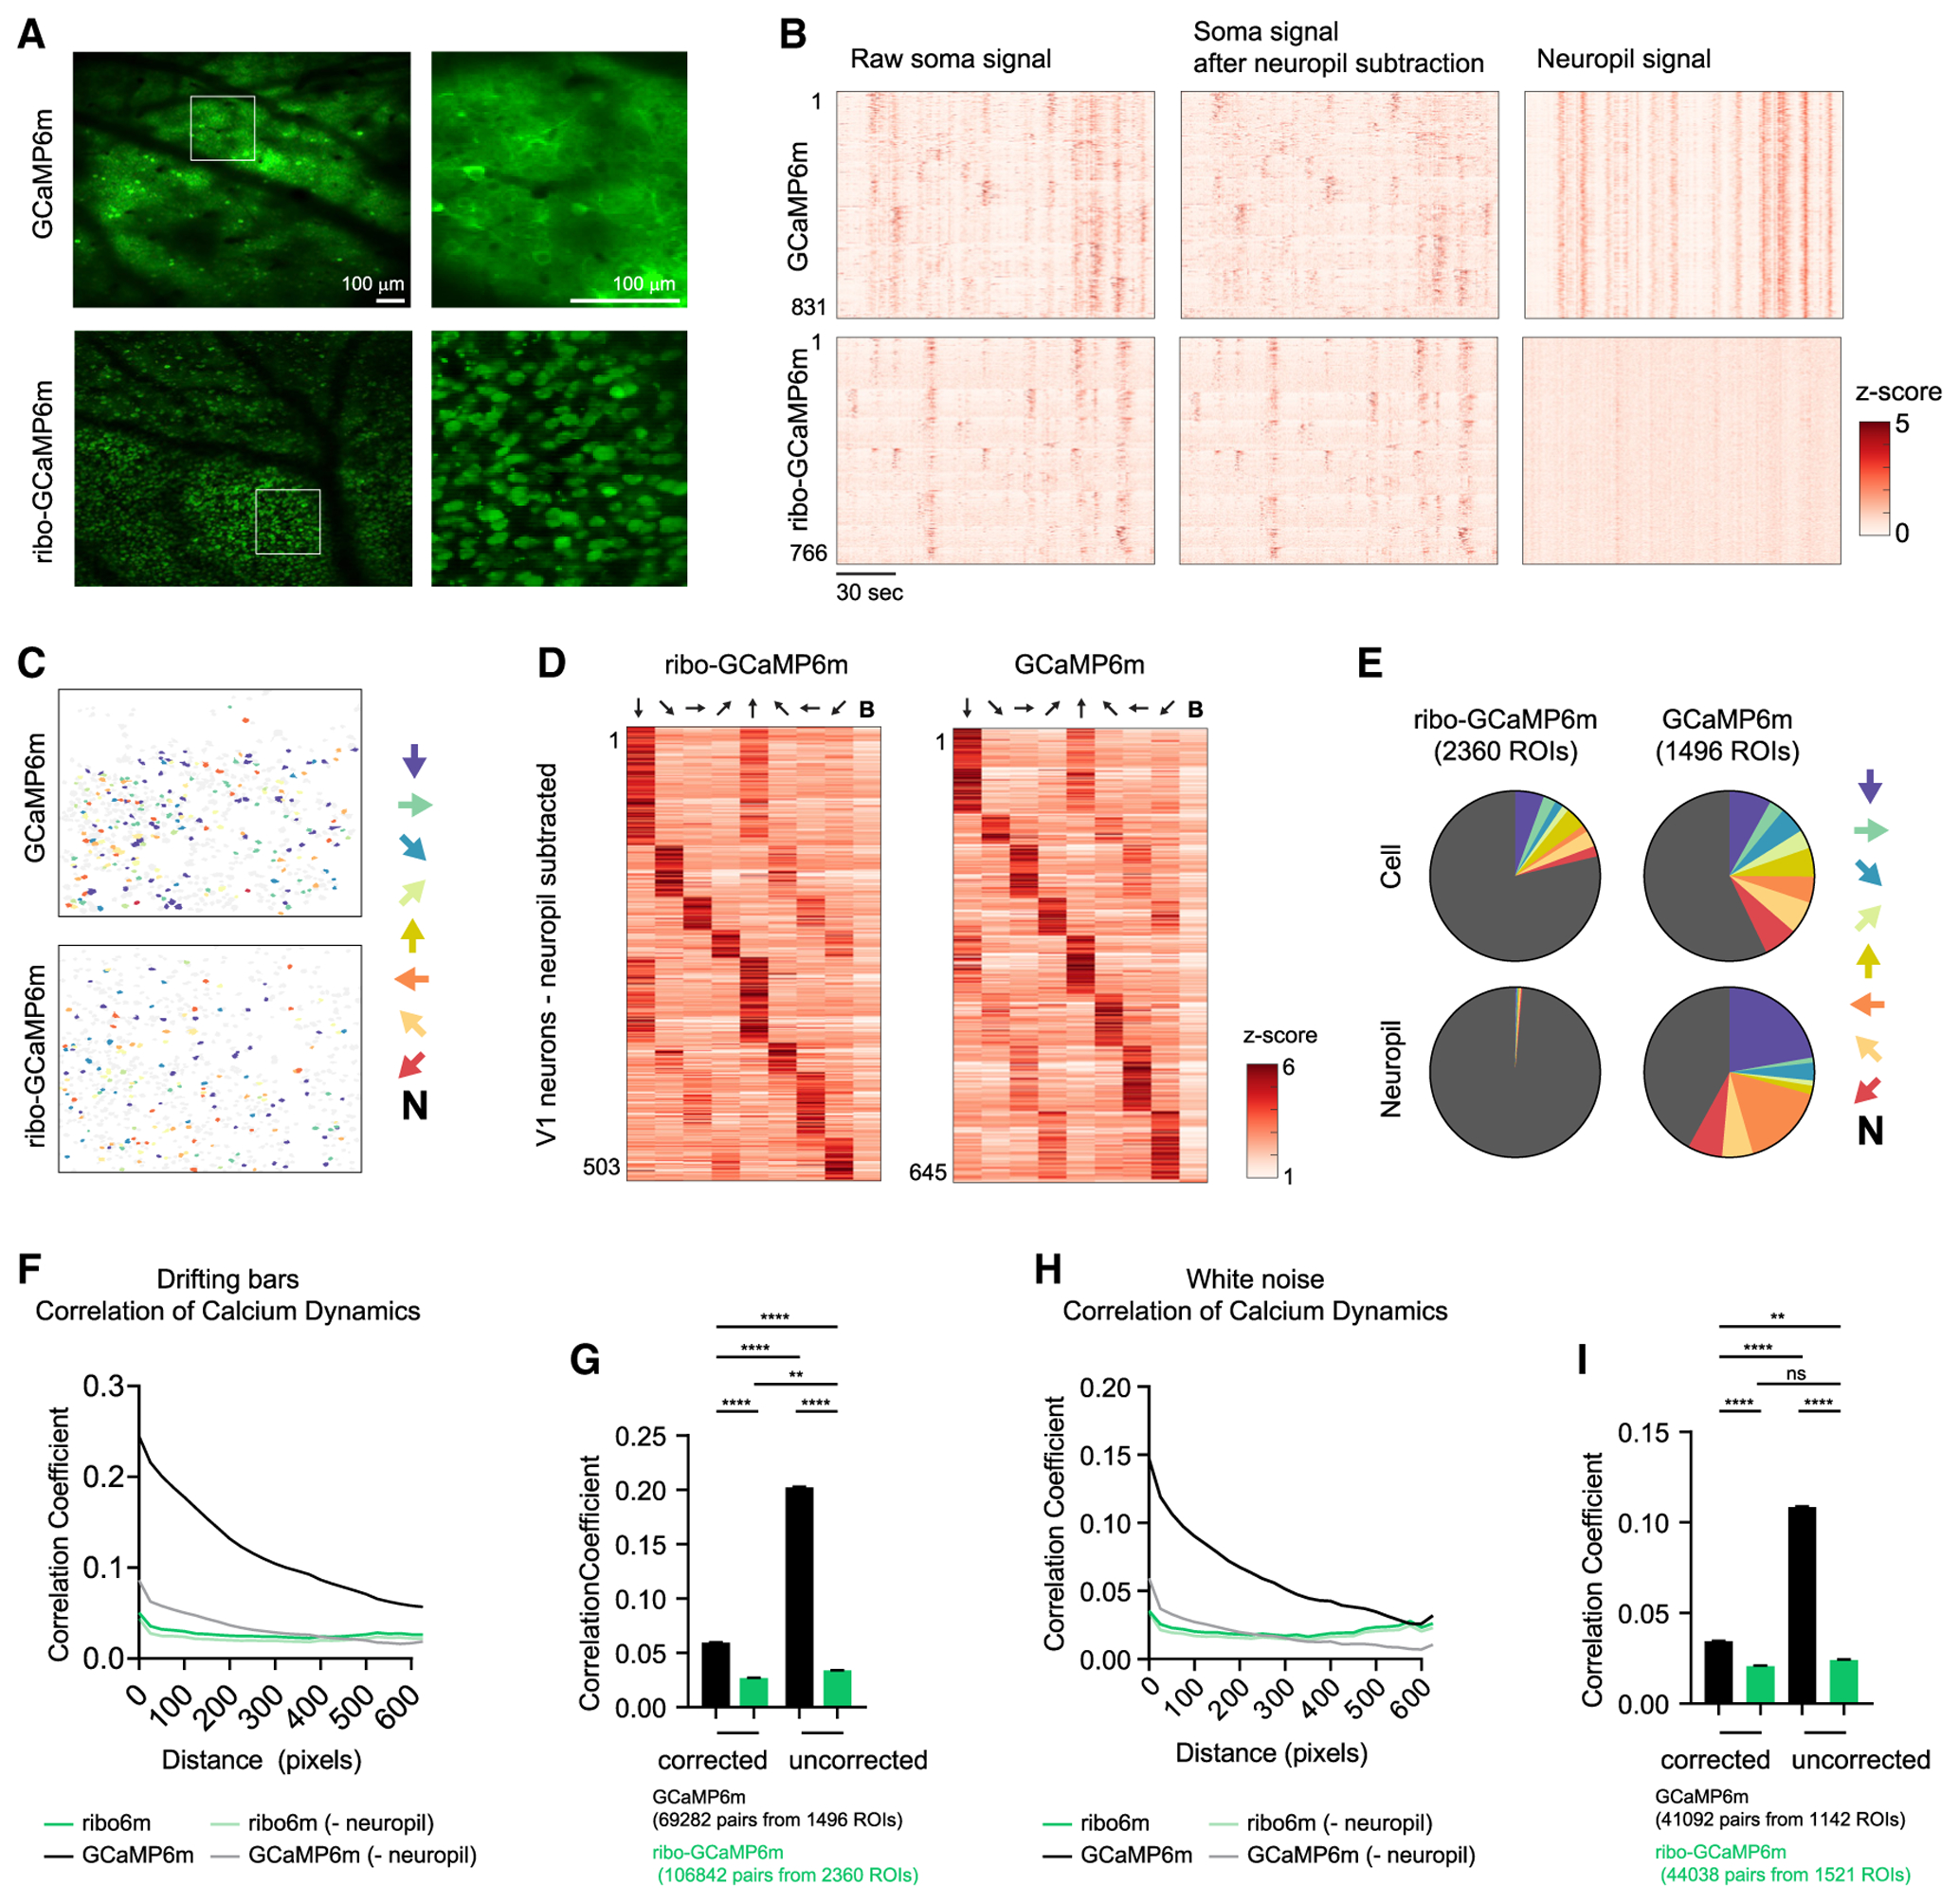
Figure 5. Ribo-GCaMP Reduces Neuropil Contamination during 2P Imaging.

(A) Example fields of view of V1 neurons expressing GCaMP6m (top) or ribo-GCaMP6m (bottom).
(B) Calcium dynamics of neurons recorded from a single video. Calcium dynamics are either uncorrected (left) or with surrounding neuropil signal subtracted (right). Cells are sorted based on orientation tuning.
(C) Color coded ROIs based on orientation selectivity in V1.
(D) Peak response of angle-selective V1 neurons to drifting bars with different angles.
(E) Distribution of orientation selectivity. ROIs are either neurons or neuropils, which is defined as the area surrounding each identified neuron.
(F–I) Correlation coefficient analysis of neural signal for either GCaMP6m or ribo-GCaMP6m. The neuropil signal was either subtracted or not, as indicated. During recording, mice were exposed to either drifting bars (F and G) or white noise (H and I).
(F) Correlation coefficient of calcium dynamics between pairs of neurons plotted against the centroid distance. R2 = 0.92, 0.19, 0.84, and 0.10; p < 0.0001, 0.0208, < 0.0001, and 0.0970 for regular uncorrected, ribo-uncorrected, regular, and ribo, respectively, linear regression of averaged values.
(G) Correlation coefficient of calcium dynamics between pairs of neurons that are within 100 pixels. Regular corrected: 0.105 ± 0.010; ribo-corrected: 0.081 ± 0.010; regular uncorrected: 0.227 ± 0.010; ribo-uncorrected: 0.085 ± 0.008; values are means ± SEMs.
(H) Correlation coefficient of calcium dynamics between pairs of neurons plotted against centroid distance. R2 = 0.80, 0.003, 0.62, and 0.003; p < 0.0001, 0.79, < 0.0001, and 0.79 for regular uncorrected, ribo-uncorrected, regular, and ribo, respectively, linear regression of averaged values.
(I) Correlation coefficient of calcium dynamics between pairs of neurons that are within 100 pixels. Regular corrected: 0.034 ± 0.002; ribo-corrected: 0.021 ± 0.002; regular uncorrected: 0.109 ± 0.002; ribo-uncorrected: 0.024 ± 0.002; values are means ± SEMs.
In (C)–(E), arrows indicate the drifting bar orientation that the corresponding color (C and E) or column (D) represents. In (C) and (E), N denotes “nonselective,” which means that these neurons did not pass the criteria to be defined as orientation tuned (see Method Details). In (D), B denotes “blank,” in which no stimulus was given. In (G) and (I), **p < 0.01, ****p < 0.0001, ns, p > 0.05, 1-way ANOVA, Holm-Sidak post hoc test. Total numbers of cells were used to estimate degrees of freedom when calculating SEM; 1 pixel = ~1.9 μm.
