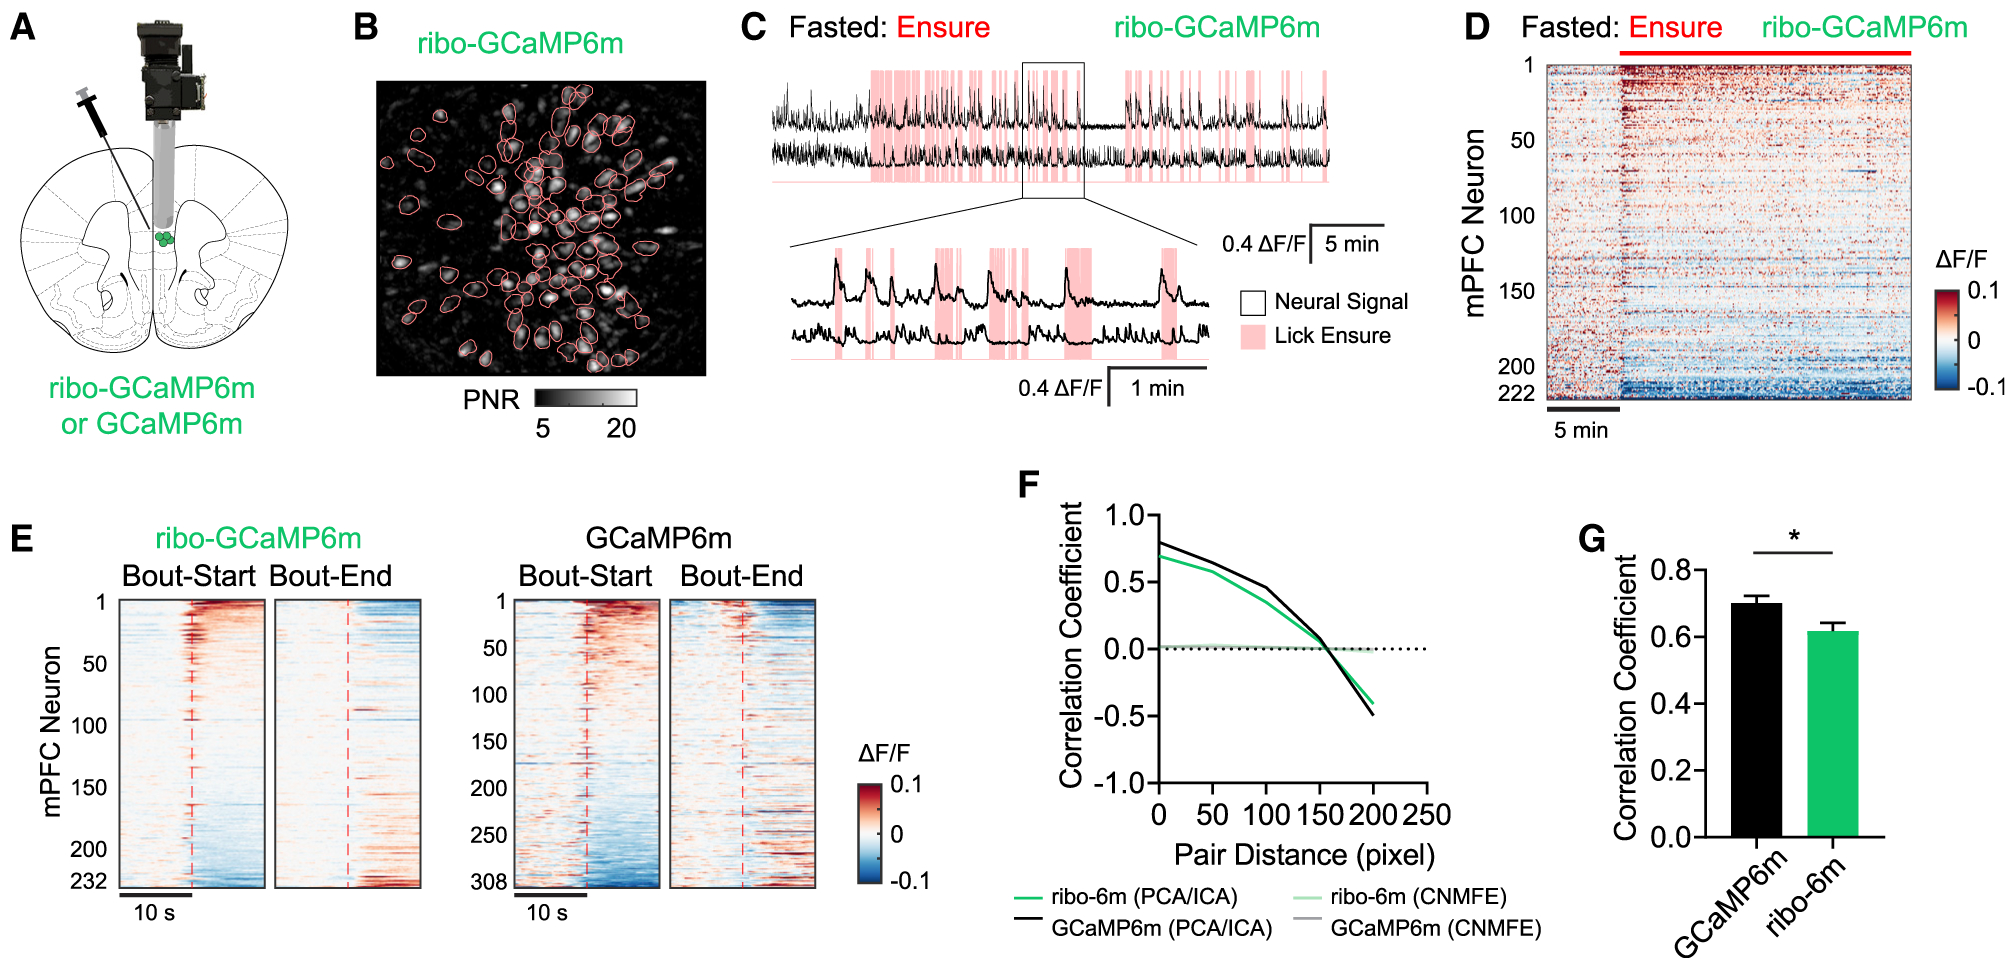
Figure 6. Microendoscope Recording of mPFC Dynamics Using Ribo-GCaMP.

(A) Ribo-GCaMP6m expression was targeted to mPFC, and a GRIN lens was implanted for microendoscope recordings.
(B) Representative field of view of ribo-GCaMP6m imaged through a microendoscope, with ROIs (pink contours) indicated.
(C) Representative extracted calcium dynamics (black traces) time synchronized with licking events (pink shading) of liquid food in the fasted state.
(D) Response of mPFC neurons in fasted mice to the consumption of Ensure. Red bar indicates when food was made available.
(E) Peristimulus time histogram (PSTH) aligned to either the initiation or termination of licking bouts. Calcium dynamics were measured using either ribo-GCaMP6m (left) or GCaMP6m (right).
(F and G) Pearson correlation coefficient between the signal from different pairs of ROIs. mPFC neural dynamics were recorded in fed mice expressing either regular GCaMP6m (n = 154 from 5 mice) or ribo-GCaMP6m (n = 69 from 4 mice) during cage exploration. In (F), calcium dynamics were extracted using either PCA-ICA or CNMF_E methods, and the correlation coefficient is plotted against the distance between corresponding ROIs. In (G), calcium dynamics were extracted by PCA-ICA and the correlation coefficient between pairs within 100 pixels is compared for GCaMP6m and ribo-GCaMP6m. *p < 0.05, unpaired t test; cell number was used as degree of freedom when calculating SEMs.
