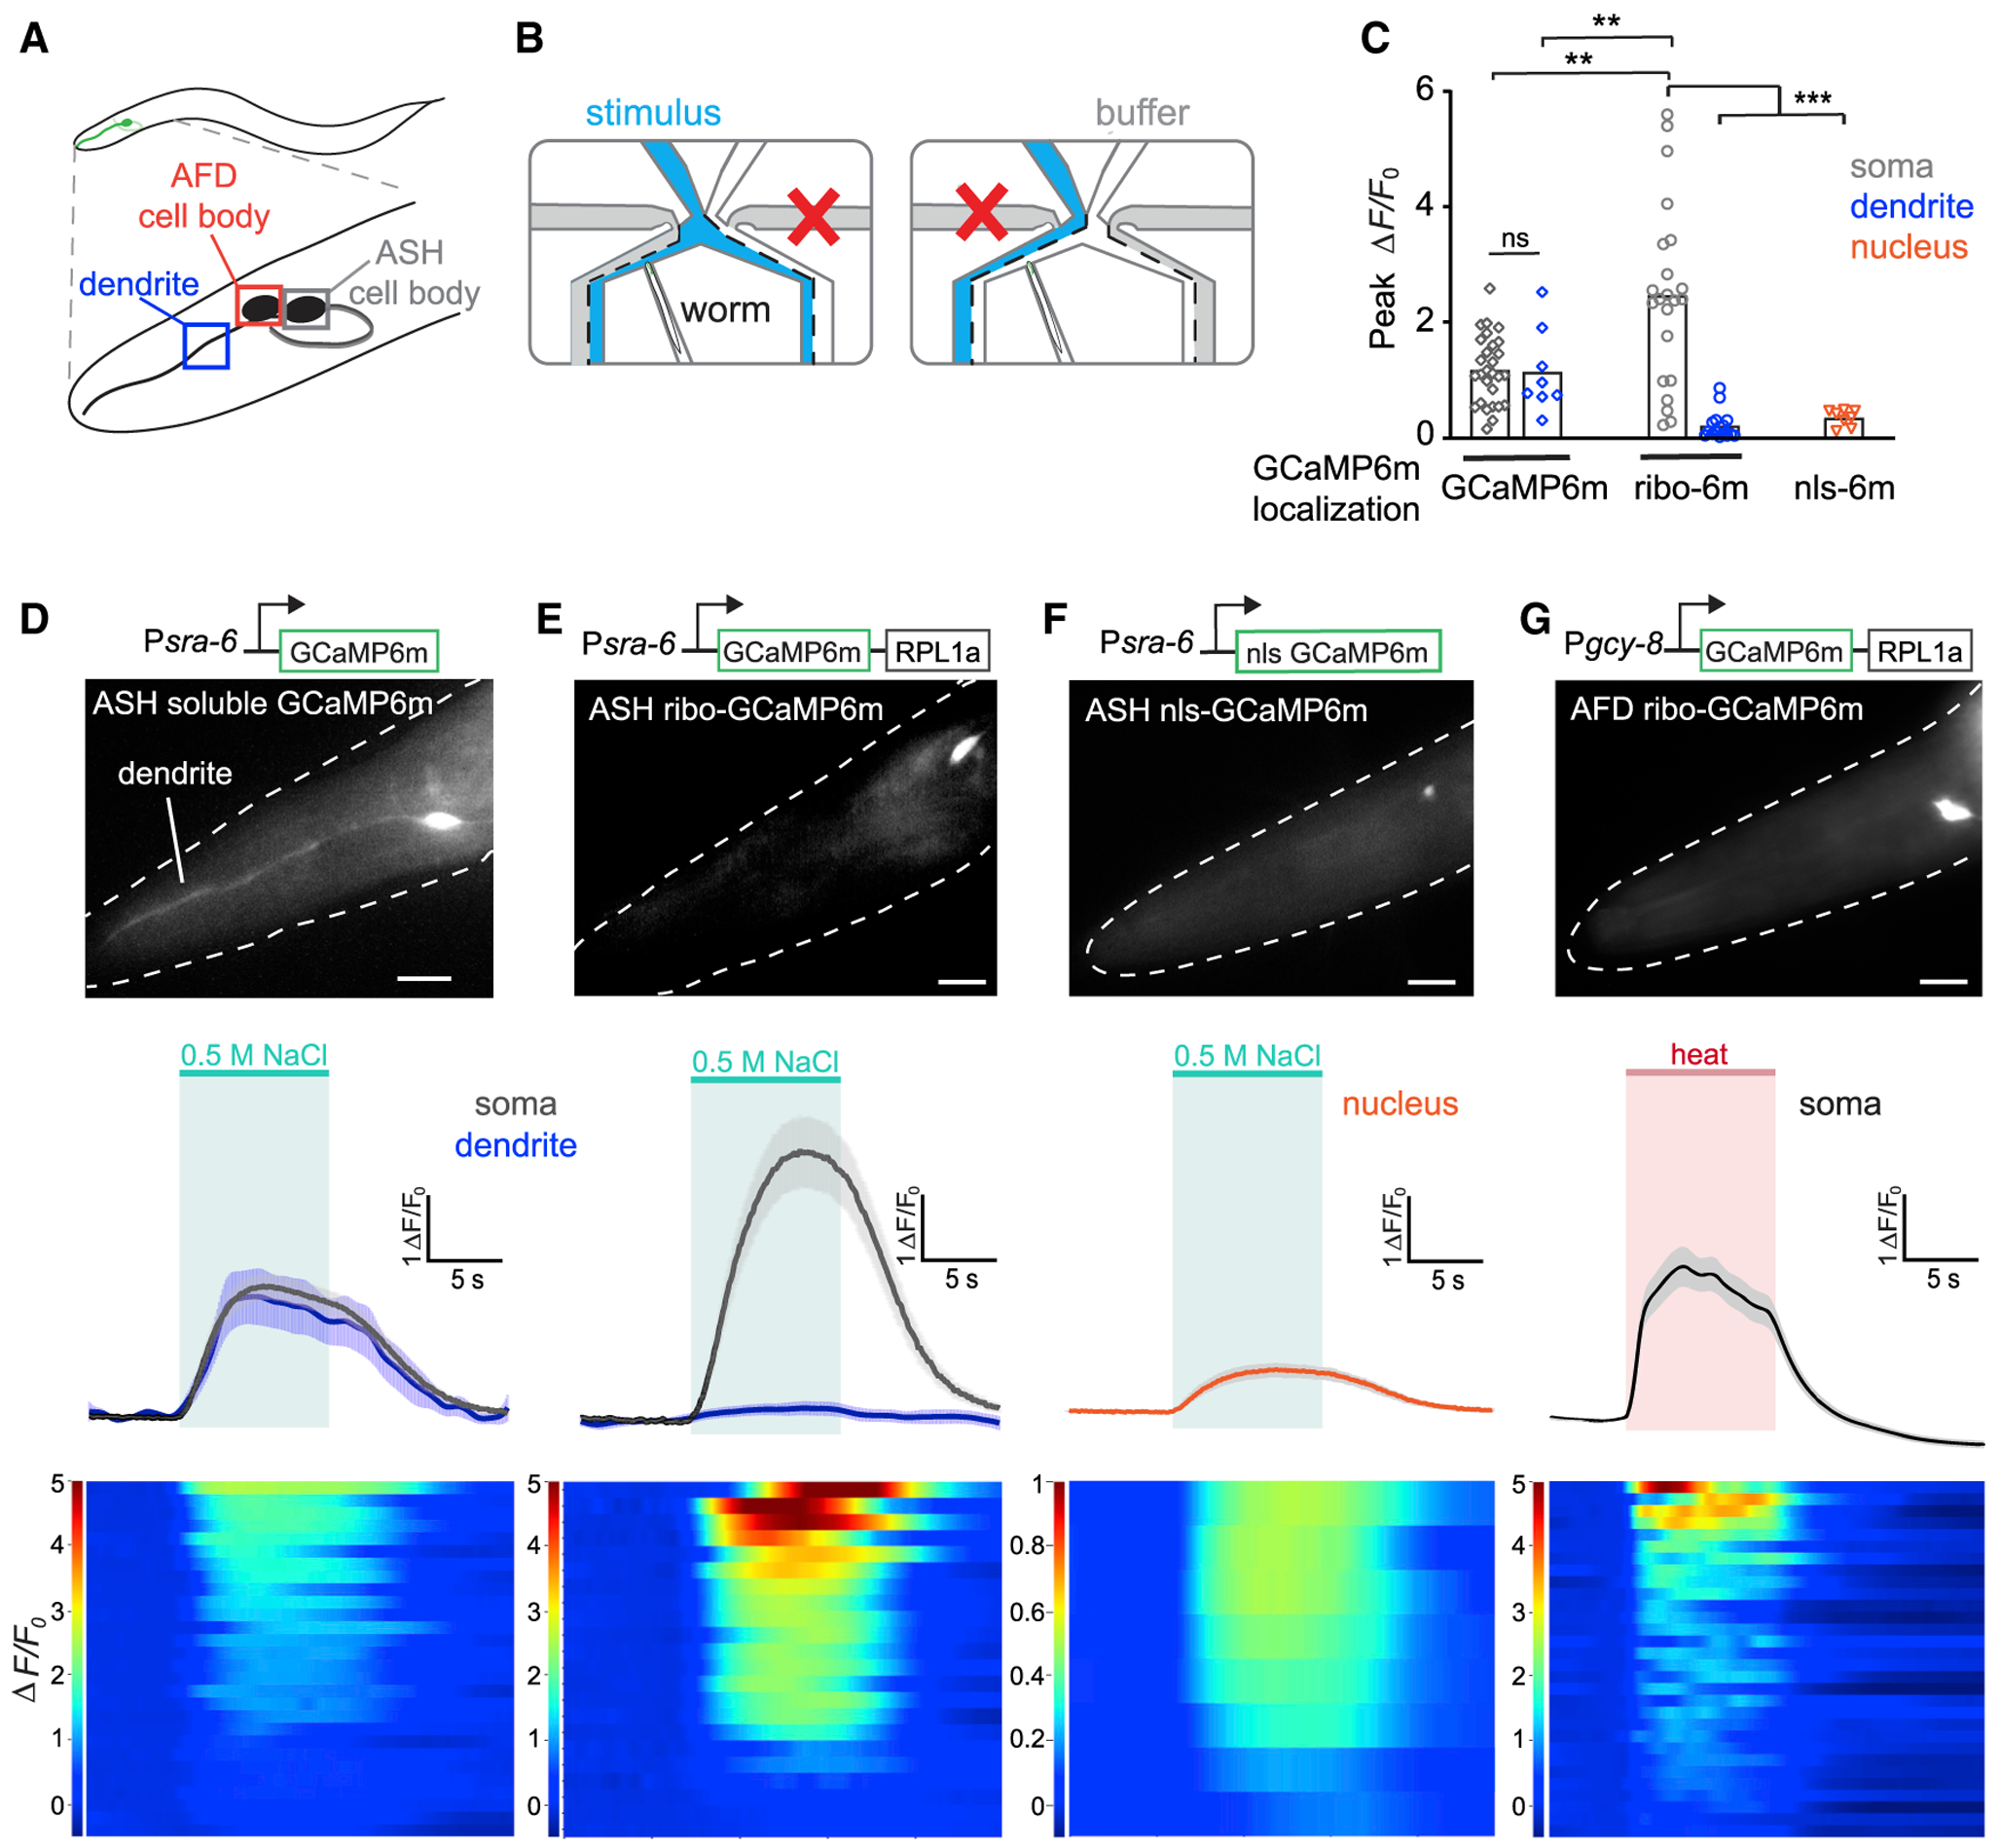
Figure 7. Stimulated In Vivo Calcium Imaging of C. elegans ASH and AFD Neuronal Activity with Ribo-GCaMP.

(A) Schematic representation of ASH and AFD neurons in the worm head. Boxes indicate ASH cell body, AFD cell body, and ASH dendrite, respectively.
(B) Animals were imaged in a microfluidic device that allows switchable fluid flow past the nose.
(C) Response amplitude ΔF/F0 for imaging traces shown in (D)–(F); GCaMP6m localization for soma in gray, dendrite in blue, and nucleus in orange.
(D–G, top) Diagram of constructs used to make transgenic worm strains. sra-6 promoter drives expression in ASH; gcy-8 promoter drives expression in AFD. Representative images showing fluorescent responses in ASH and AFD; dotted white lines denote worm head; scale bars, 10 μm.
(D–G, center) Mean fluorescence transients in ASH neurons expressing GCaMP6m (D), ribo-GCaMP6m (E), or nuclear-localized (nls)-GCaMP6m (F), in response to a 10-s 0.5 M NaCl pulse (green area denotes stimulus; means ± SEMs). Black and gray traces denote responses in cell soma; blue traces denote responses in dendrites. (G) Mean fluorescence transients in AFD neurons expressing ribo-GCaMP6m in response to a 10-s pulse of warm (~30°C) buffer (red area denotes stimulus).
(D–G, bottom) Heat plots of individual soma responses, 1 neuron per row. Change in fluorescence from baseline over time (ΔF/F0) is represented in the color bars at left. n = 11 worms responding to 2 consecutive salt pulses for ASH ribo-GCaMP6m; 10 for ASH soluble GCaMP6m; 5 for ASH nls-GCaMP6m; 11 worms responding for 3 consecutive heat pulses for AFD ribo-GCaMP6m. **p < 0.01, ***p < 0.001, ns, not significant using unpaired t test with Welch’s correction. See also Figure S5.
