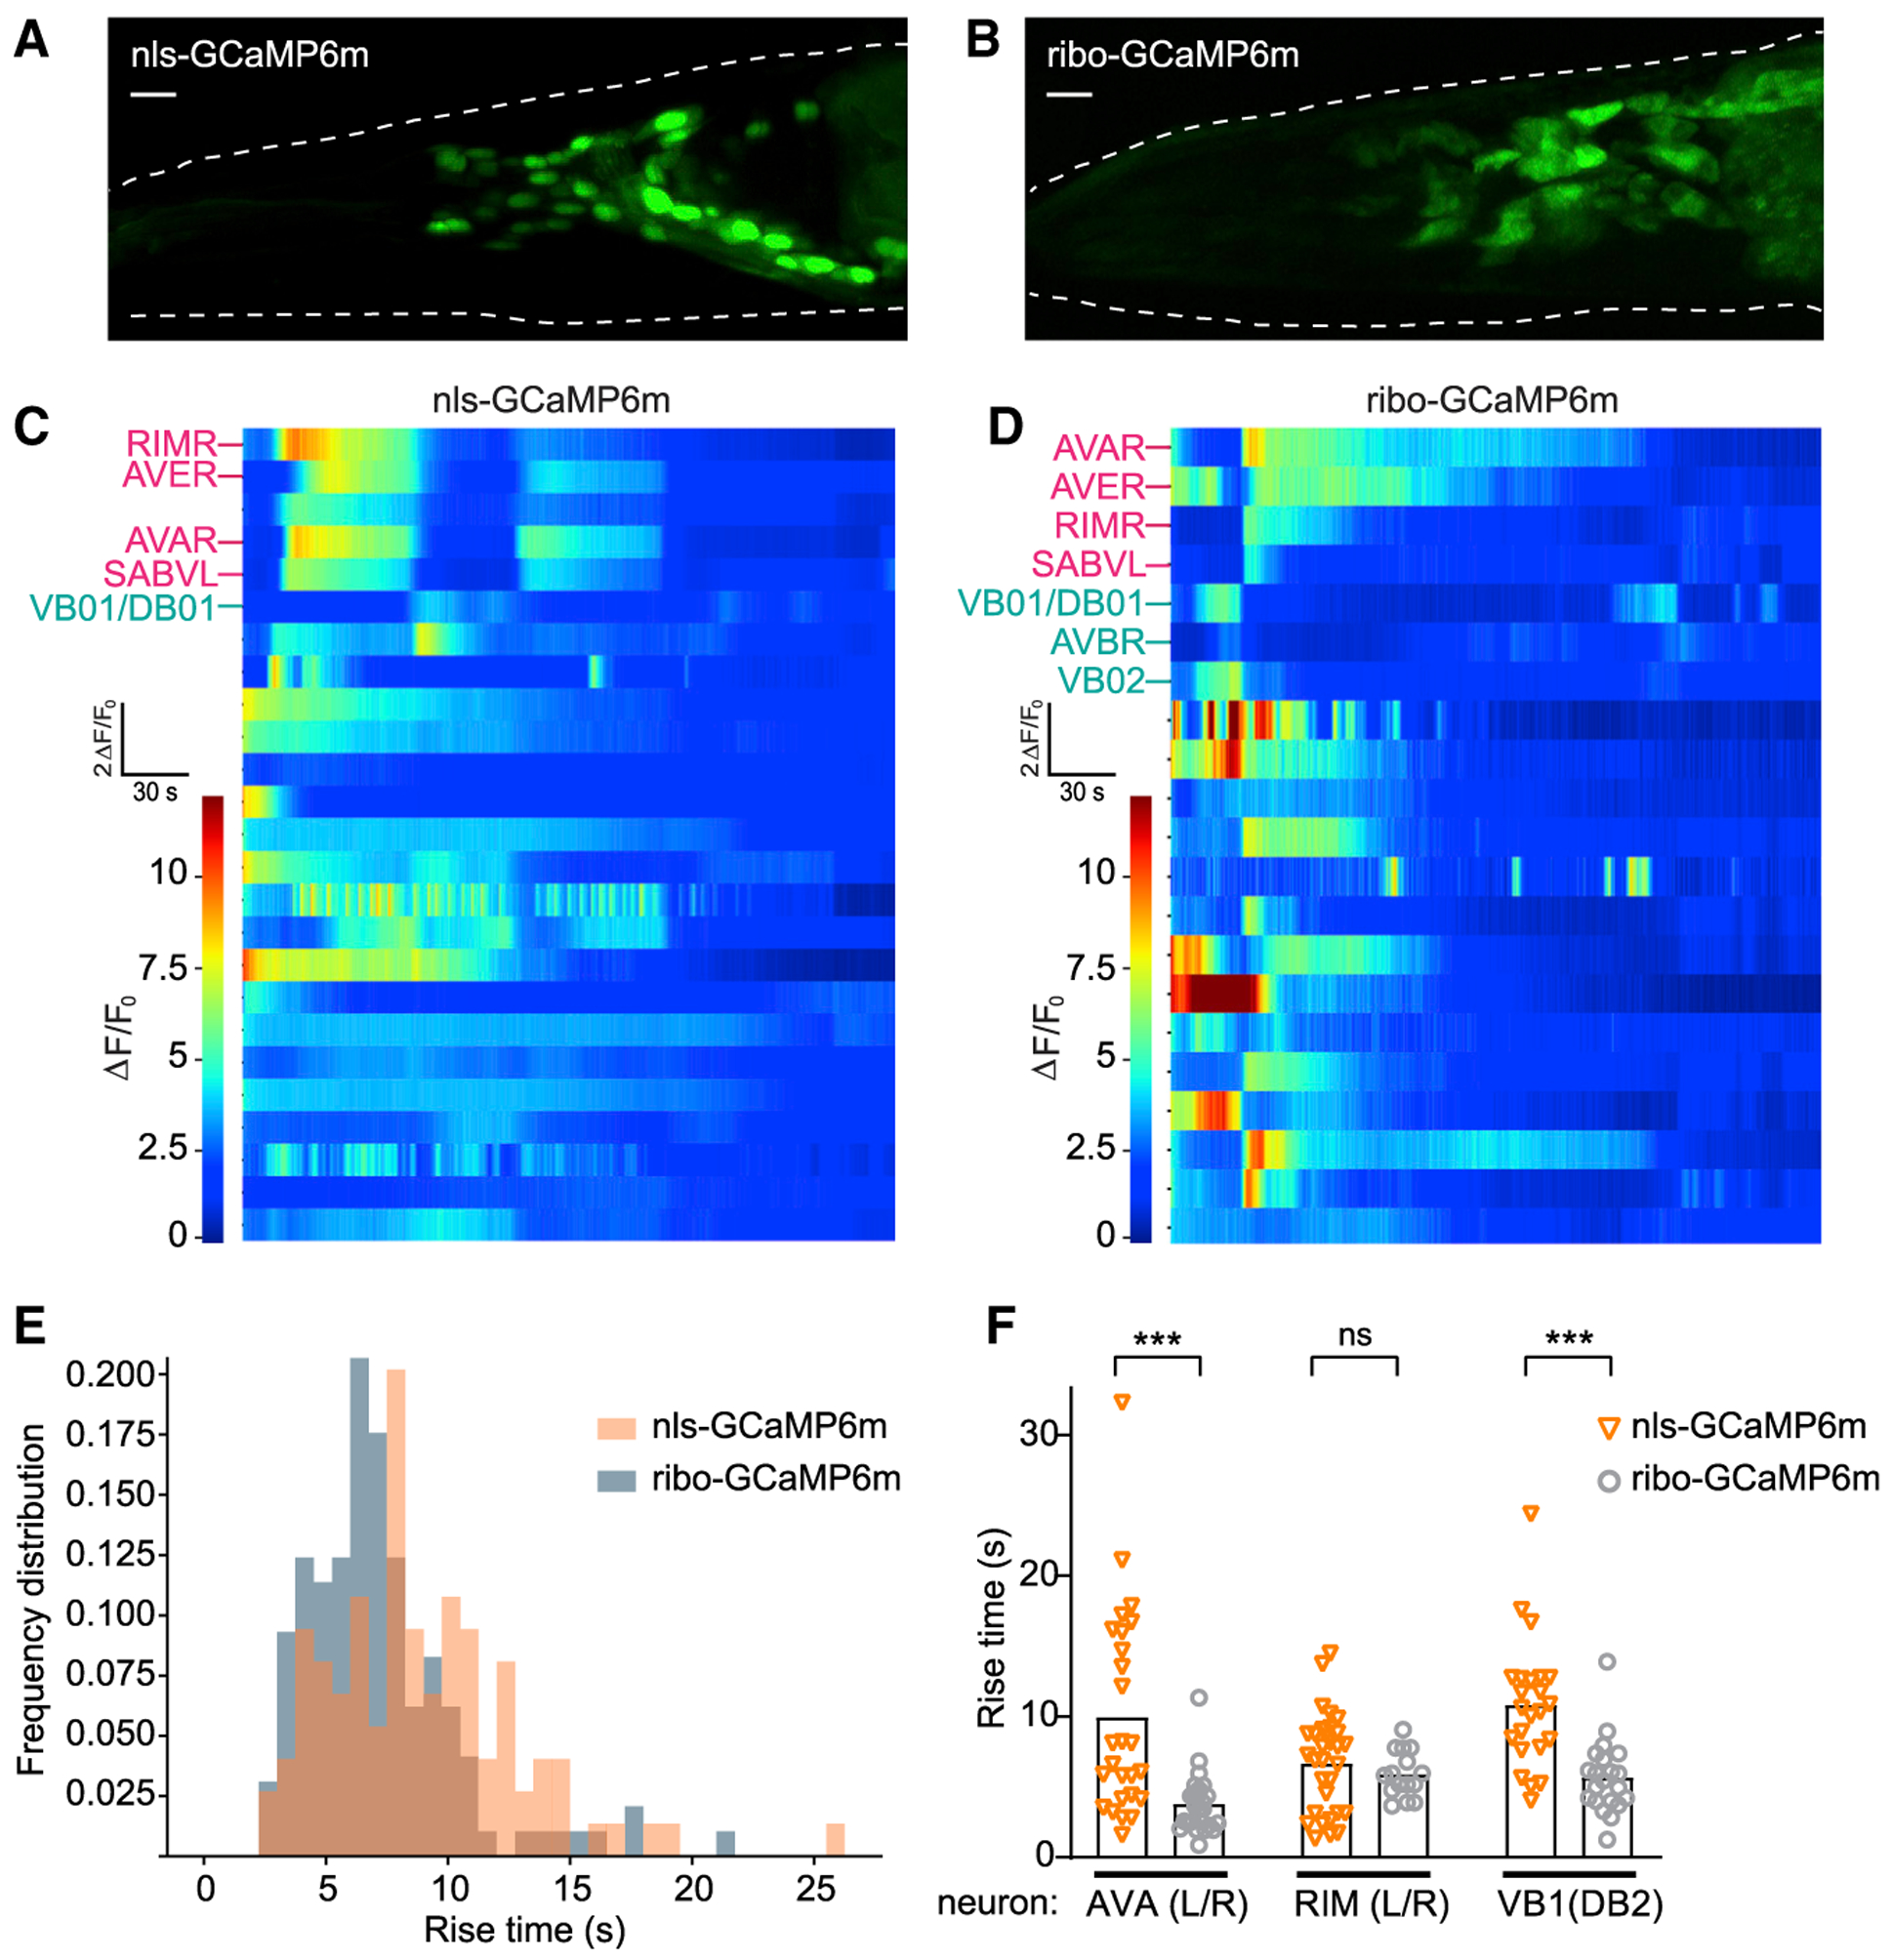
Figure 8. Whole-Brain Calcium Imaging of C. elegans Basal Neuronal Activity with Ribo-GCaMP.

(A and B) Maximum intensity projection of representative worms recorded under constant conditions expressing pan-neuronal nls-GCaMP6m (A) or ribo-GCaMP6m (B). Dotted white lines denote worm head. Scale bars, 10 μm.
(C and D) Representative heat plots of fluorescence (ΔF/F0) 5-min time series for pan-neuronal nls-GCaMP6m (C) or ribo-GCaMP6m (D), 1 neuron per row. Labeled neurons indicate putative cell IDs, PC1+ neurons in pink and PC1− neurons in cyan.
(E) Histogram of frequency distributions for all rise times of peaks in calcium transients measured for 47 ribo-GCaMP6m traces (from 5 time series recordings) and 60 nls-GCaMP6m traces (from 8 time series recordings).
(F) Rise times of peaks in calcium transients measured from the same neuron across recordings expressing either nls-GCaMP6m or ribo-GCaMP6m. ***p < 0.001, ns, not significant using Kolmogorov-Smirnov test.
