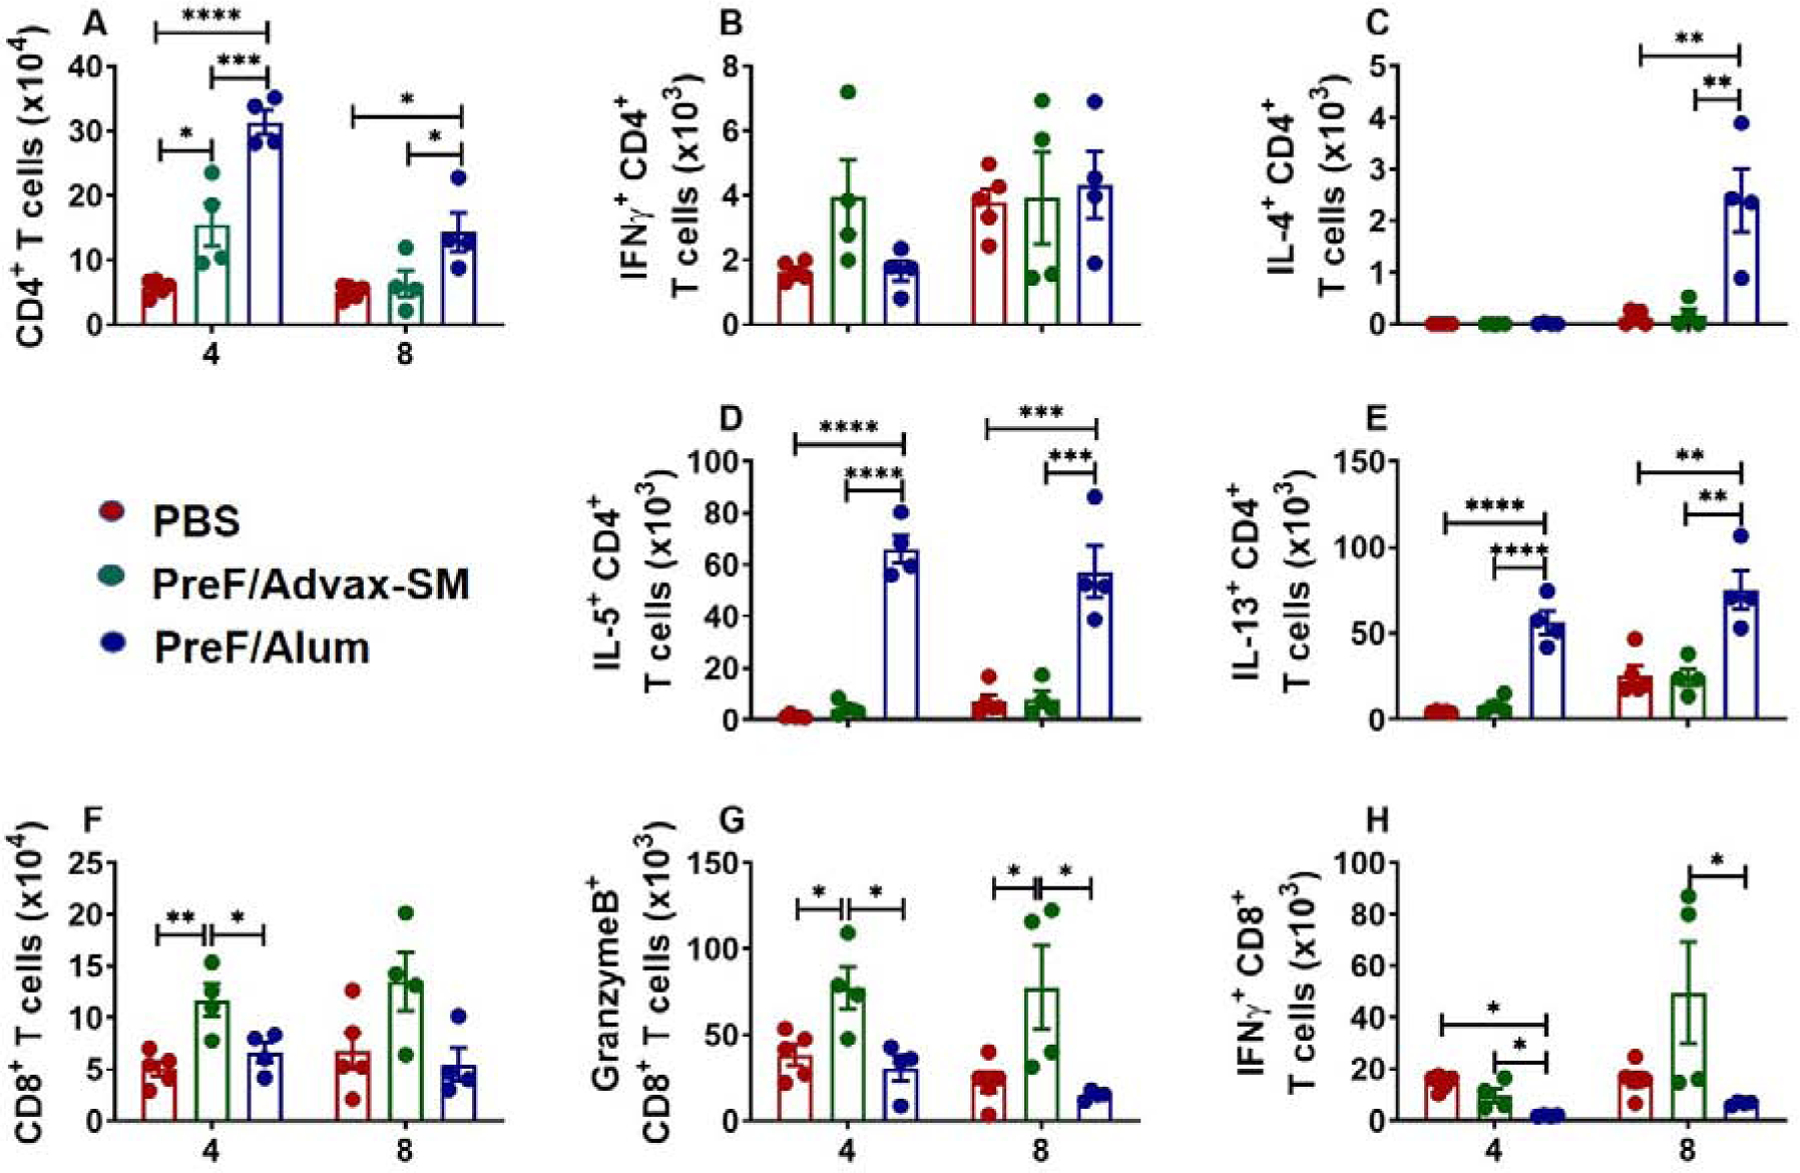
Figure 3. Alum-adjuvanted RSV PreF vaccination elicits a type-2 T cell response.

Mice were challenged, immunized, and re-challenged with RSV as described in Figure 1. At 4 or 8dpi, BAL was harvested for quantification of CD4+ T cells (A) and T cell intracellular cytokine staining of IFNγ (B), IL-4 (C), IL-5 (D), and IL-13 (E). CD8+ T cells were also quantified from the BAL at 4 and 8dpi (F) with intracellular cytokine staining of granzyme B (G) and IFNγ (H). Data are represented as mean ± SEM. Statistical significance between vaccination groups at each time point was calculated using one-way ANOVA with Tukey’s multiple comparison post-test between all groups. *p<0.05, **p<0.01, ***p<0.001, and ****p<0.0001.
