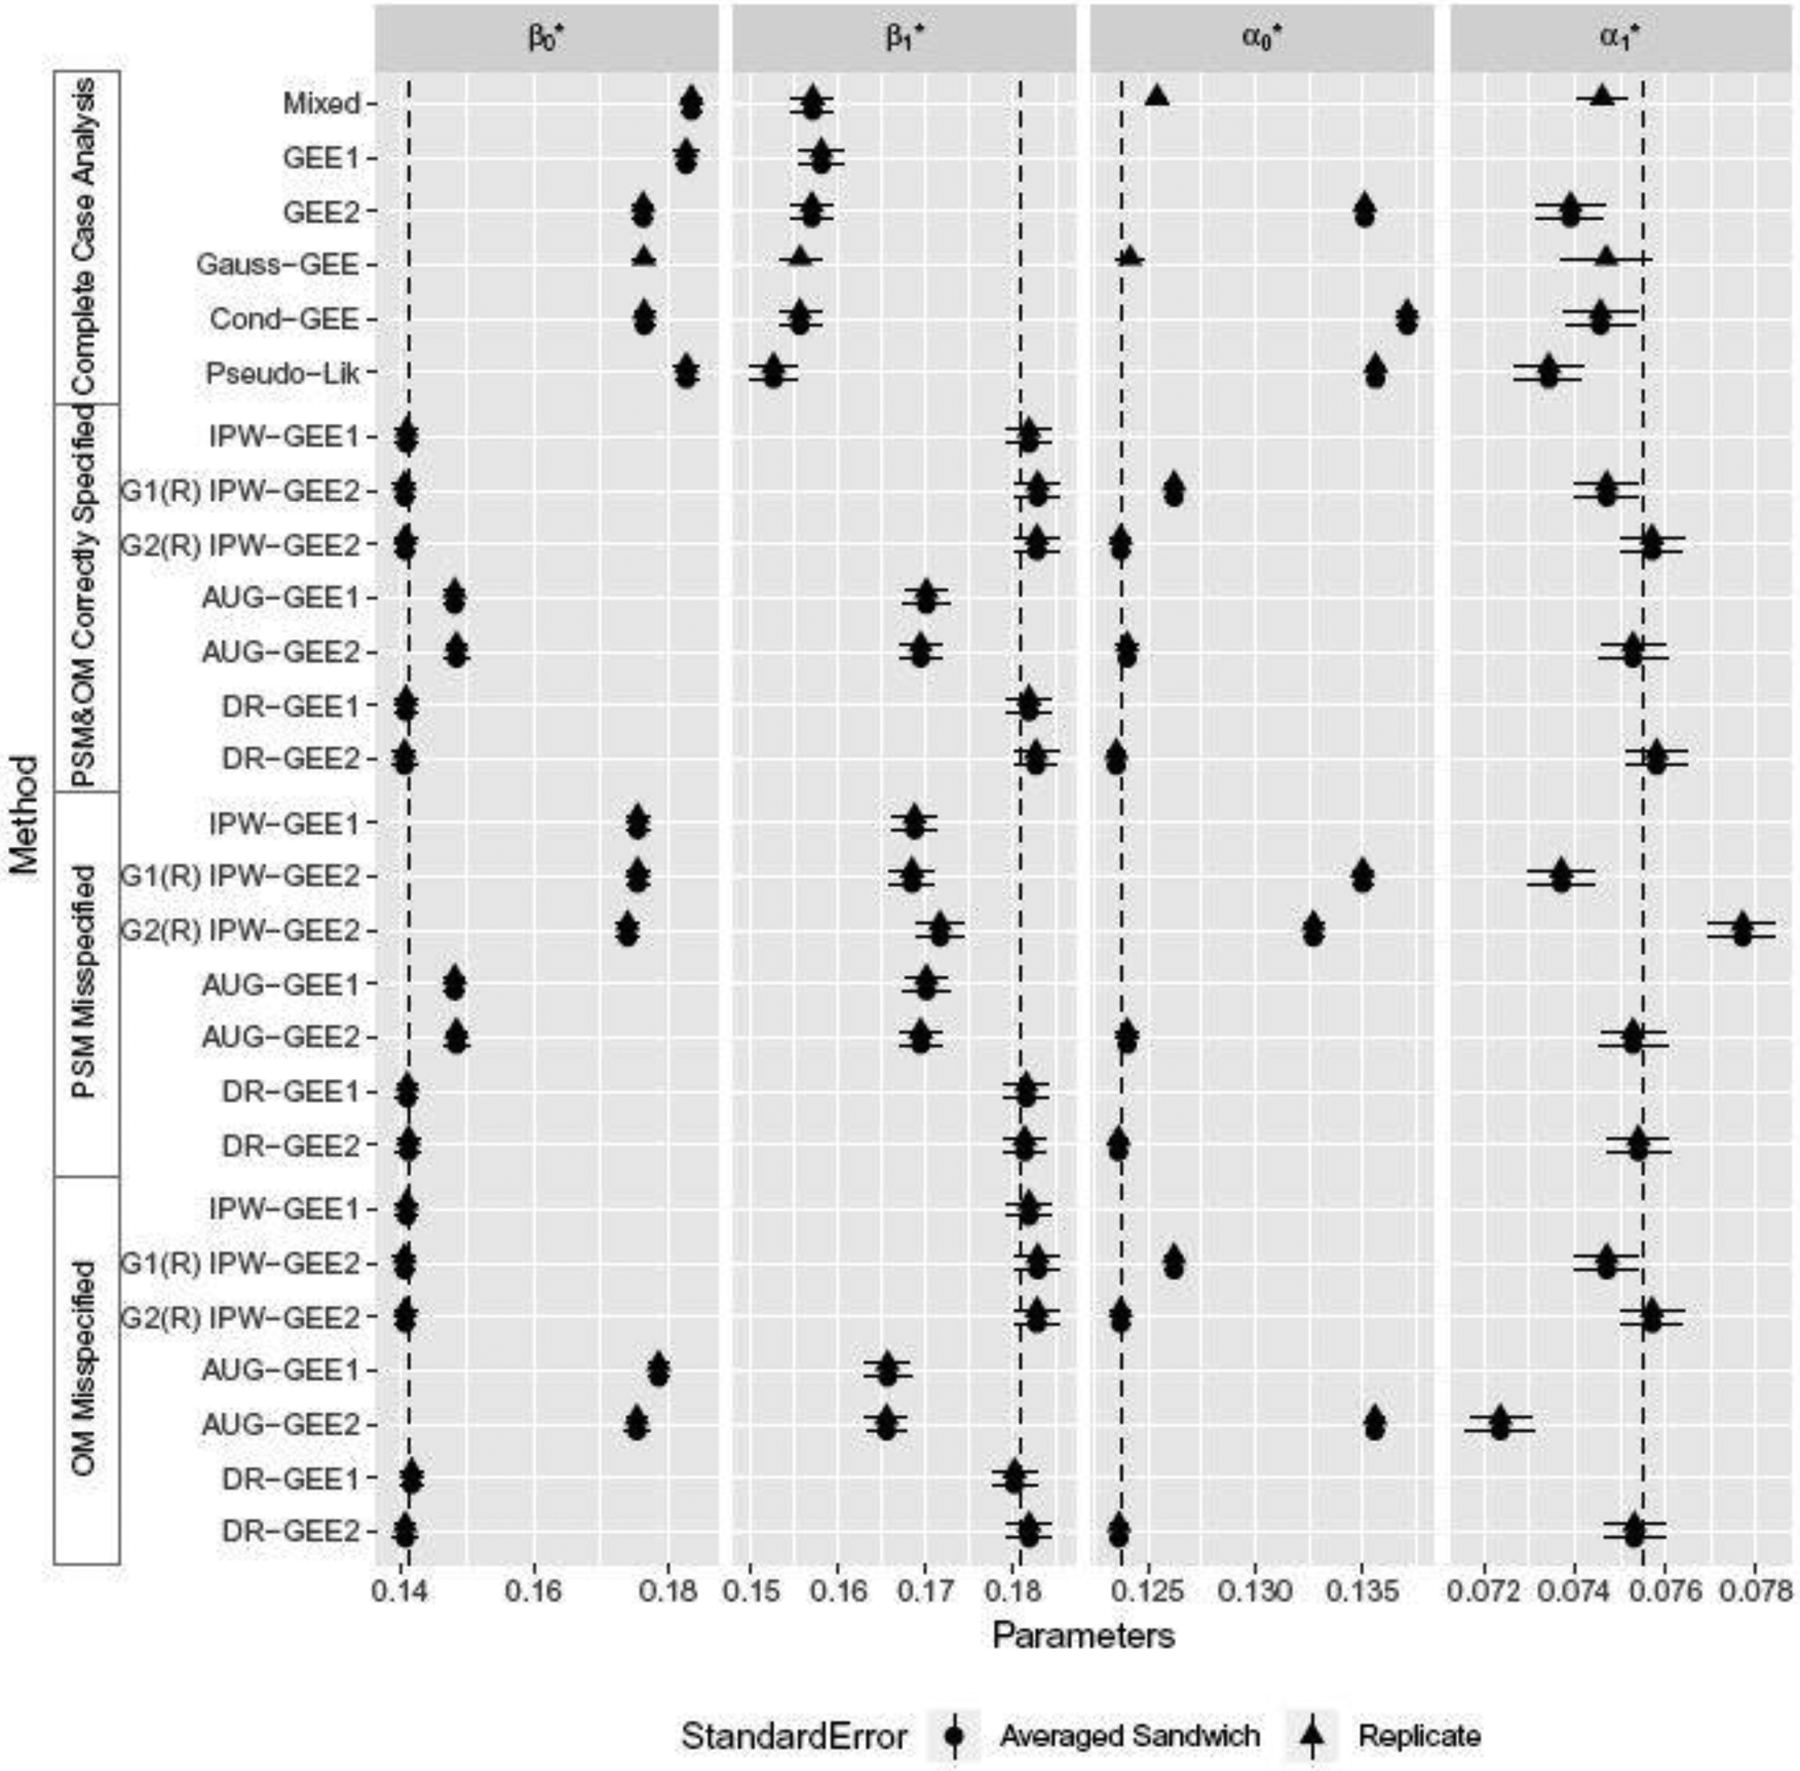
Fig. 1.

Forest plots for intervals , where is the sample average of the replicate simulations. Both Rij’s and Yij’s are simulated using Parzen’s method. Dotted vertical lines represent true parameter values.

Forest plots for intervals , where is the sample average of the replicate simulations. Both Rij’s and Yij’s are simulated using Parzen’s method. Dotted vertical lines represent true parameter values.