
Fig. 1.
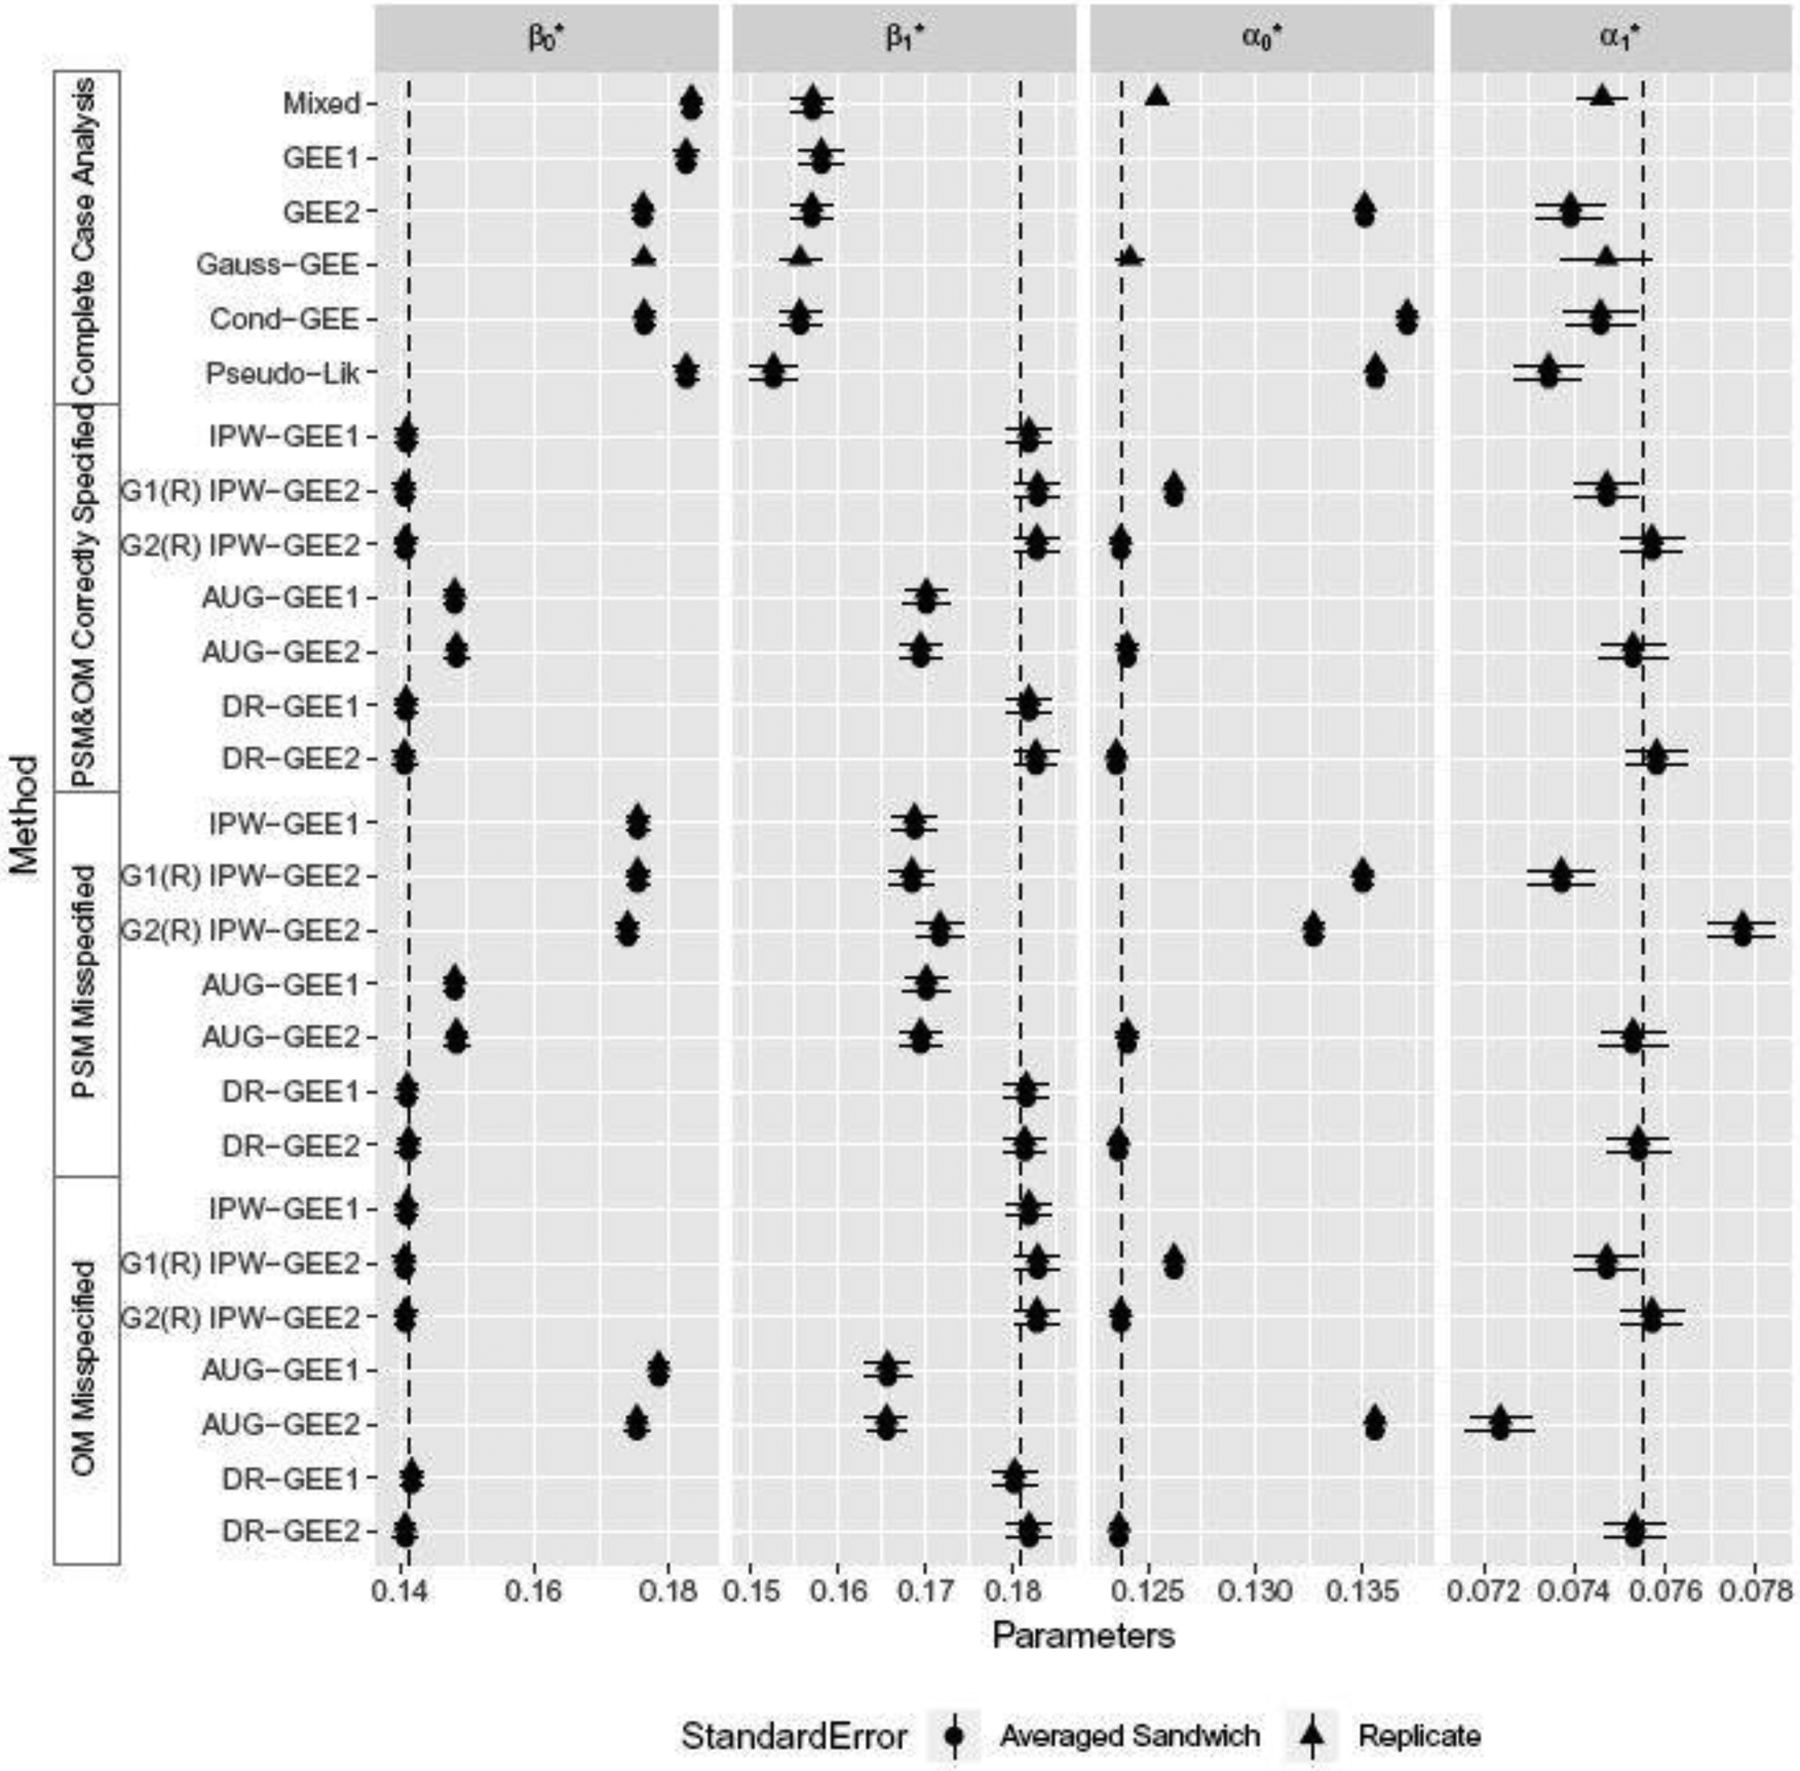
Forest plots for intervals , where is the sample average of the replicate simulations. Both Rij’s and Yij’s are simulated using Parzen’s method. Dotted vertical lines represent true parameter values.
Official websites use .gov
A
.gov website belongs to an official
government organization in the United States.
Secure .gov websites use HTTPS
A lock (
) or https:// means you've safely
connected to the .gov website. Share sensitive
information only on official, secure websites.
Forest plots for intervals , where is the sample average of the replicate simulations. Both Rij’s and Yij’s are simulated using Parzen’s method. Dotted vertical lines represent true parameter values.