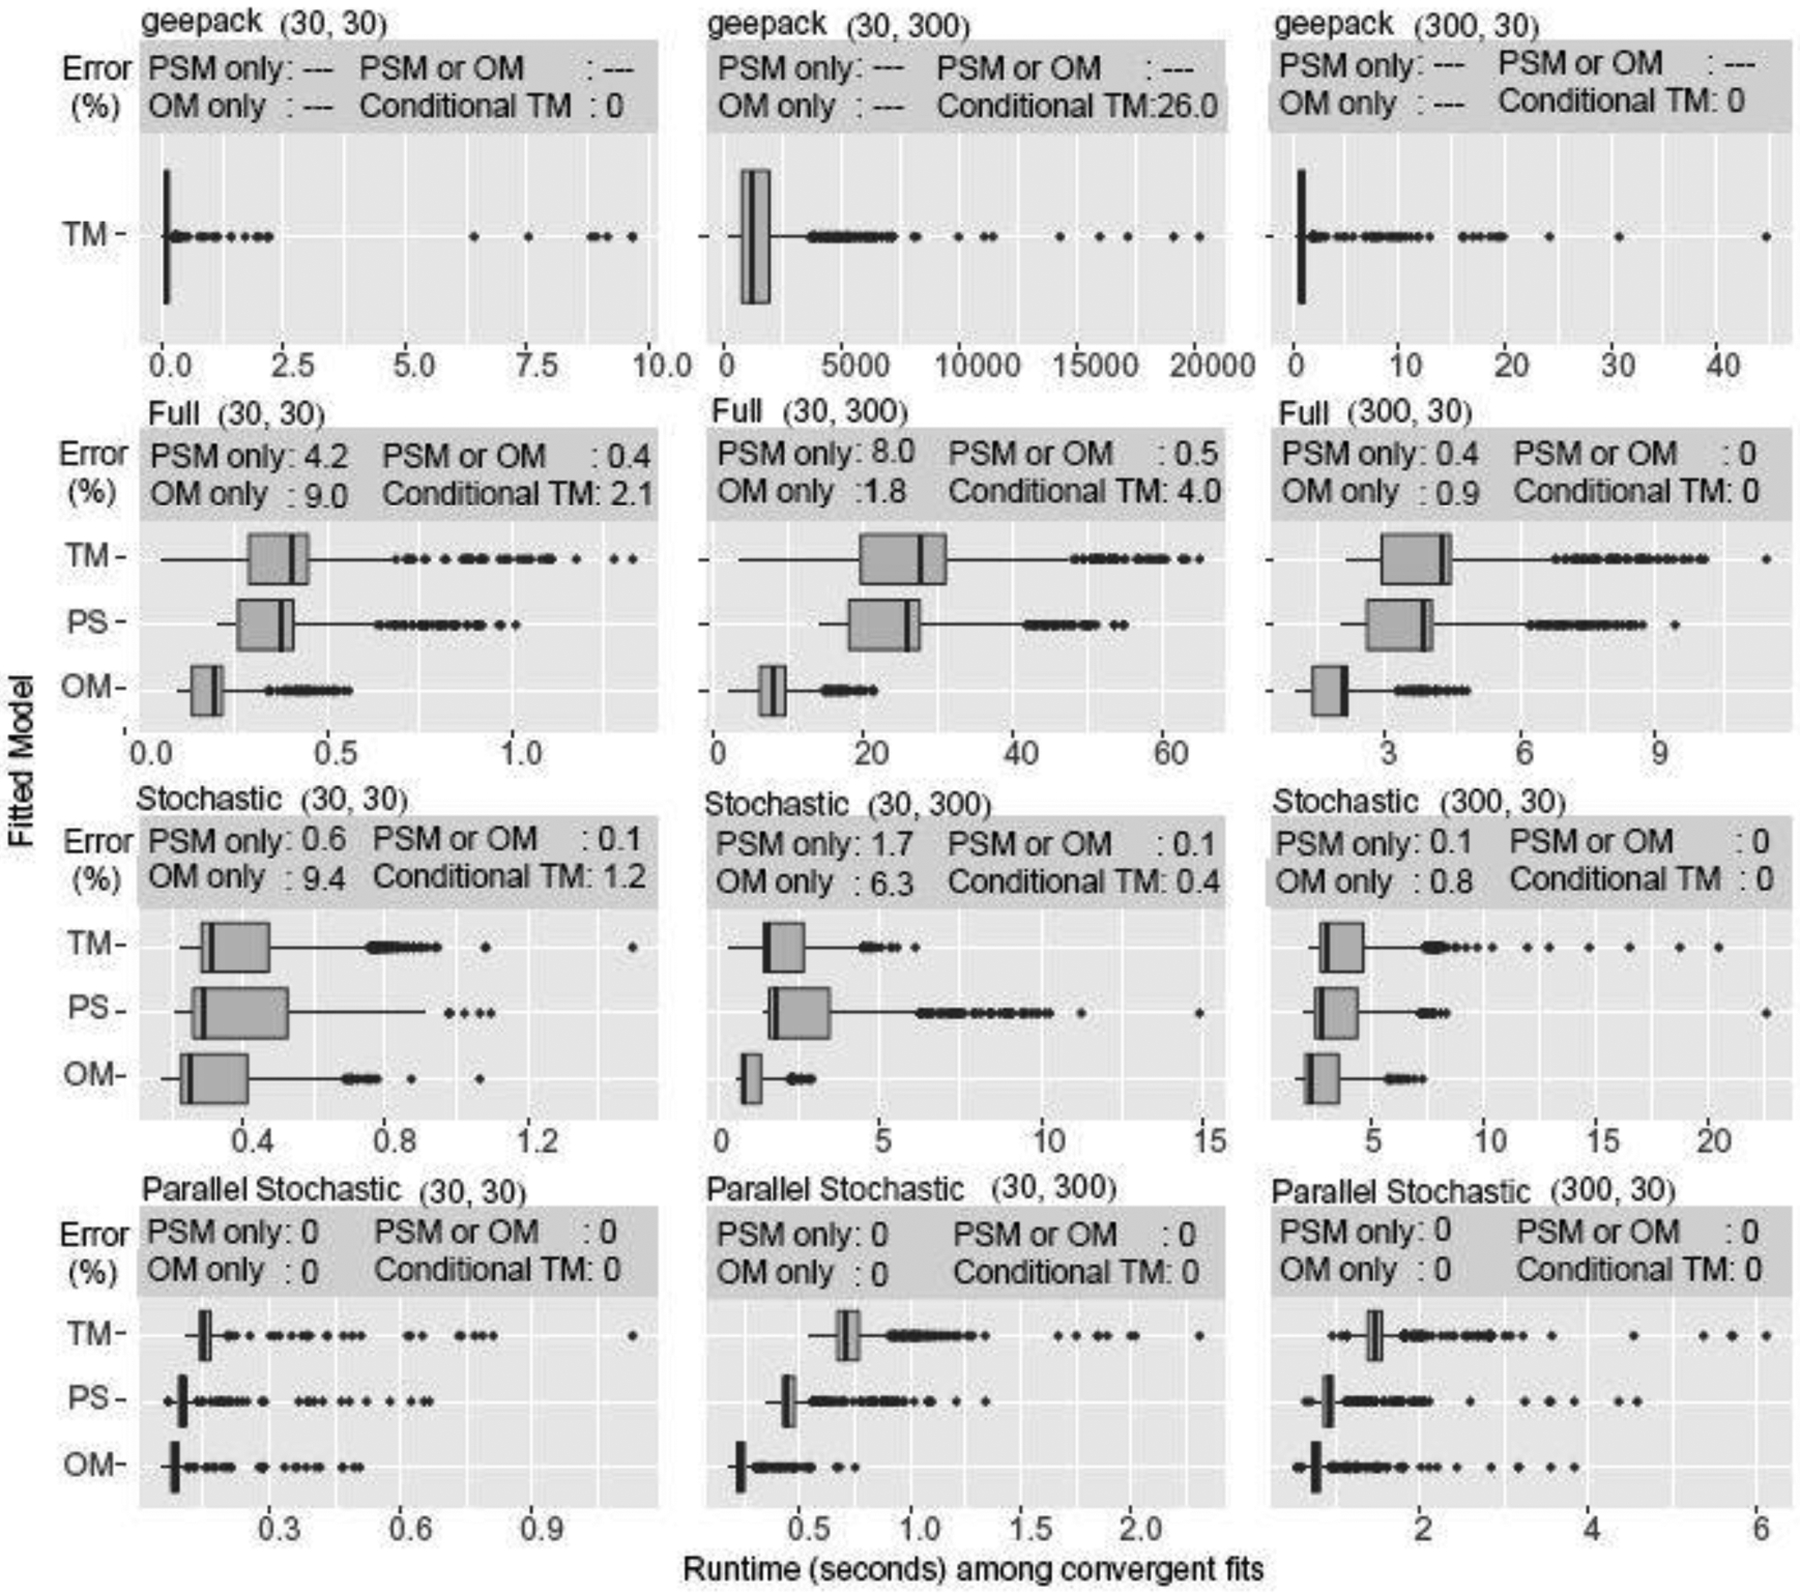
Fig. 4.

25th-50th-75th percentile boxplots of runtimes for standard, stochastic, and parallel stochastic DR-GEE2. replicate simulations. Boxplots are computed on runs which converged. The conditional TM error is the error rate among simulations whence PSM and OM converged. Each replicate simulation was executed in R on a dual-core node on the Orchestra cluster supported by the Harvard Medical School Research Information Technology Group.
