
Extended Data Fig. 8. MNase footprinting assay.
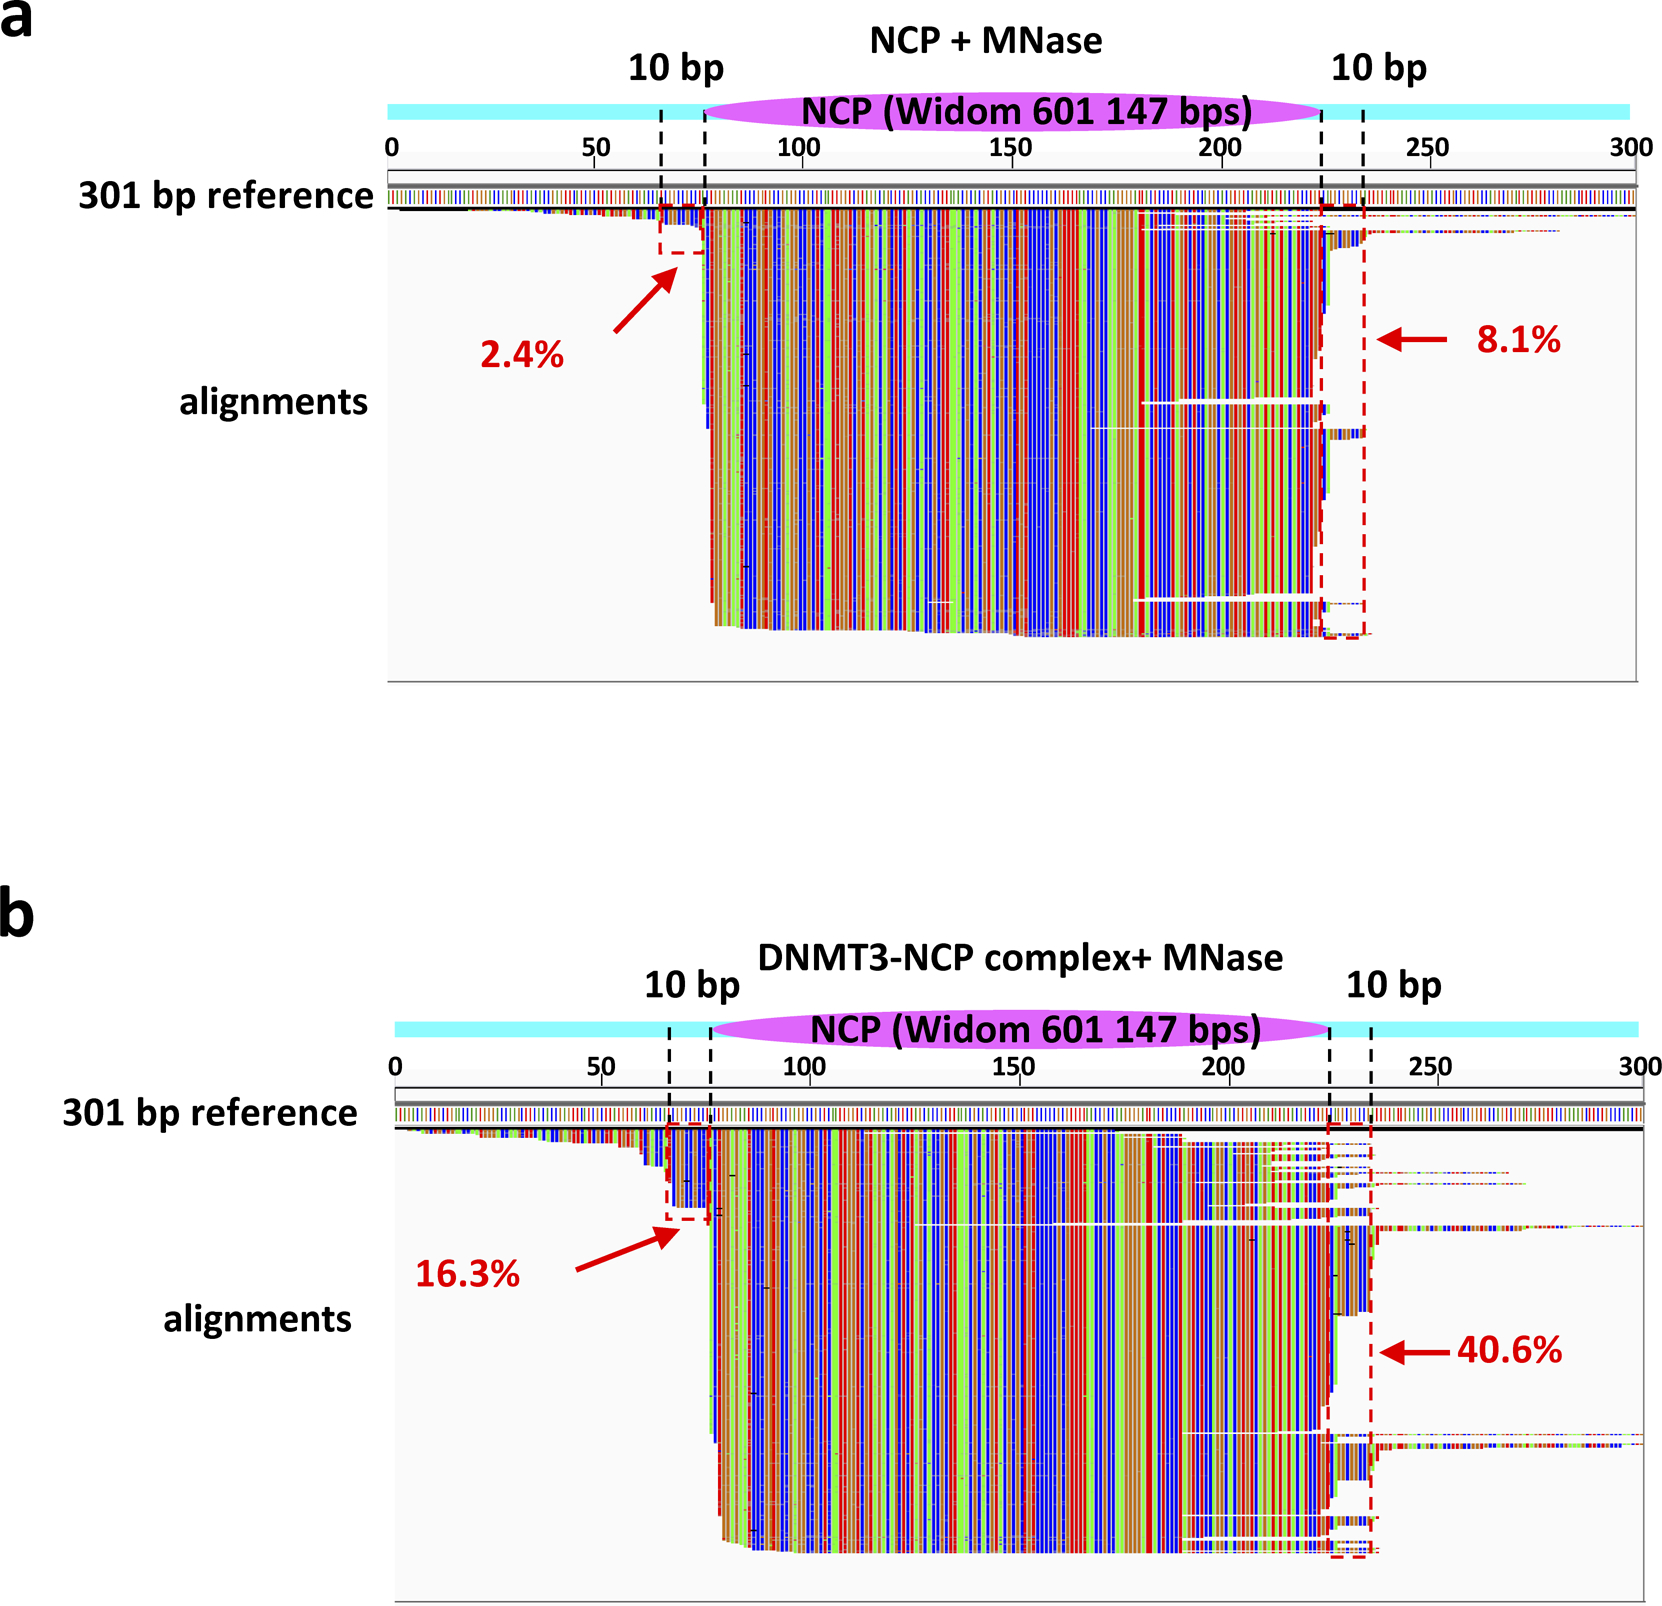
a, NCP301 alone or b, in complex with DNMT3A2/3B3 were subjected to MNase footprinting followed by DNA isolation and sequencing. Sequence reads shown by IGV viewer were aligned to the 301 bp reference to reveal the position of DNMT3A2/3B3 on individual nucleosomal DNA molecules (green = A, red = T, blue = C, brown = G). Magenta oval: position of the histone octamer (Widom 601 147 bp nucleosomal sequence); cyan bars: flexible linker region. Dashed lines demarcate the 10 bp linker regions of NCP167, and red dashed boxes represent the main DNMT protection region (protection of the DNMT/NCP complex relative to the DNMT-free NCP). The percentages of reads covering the DNMT protection regions are shown in red.