
Fig. 2. Details of the acidic patch and DNA-catalytic domain (CD) interactions.
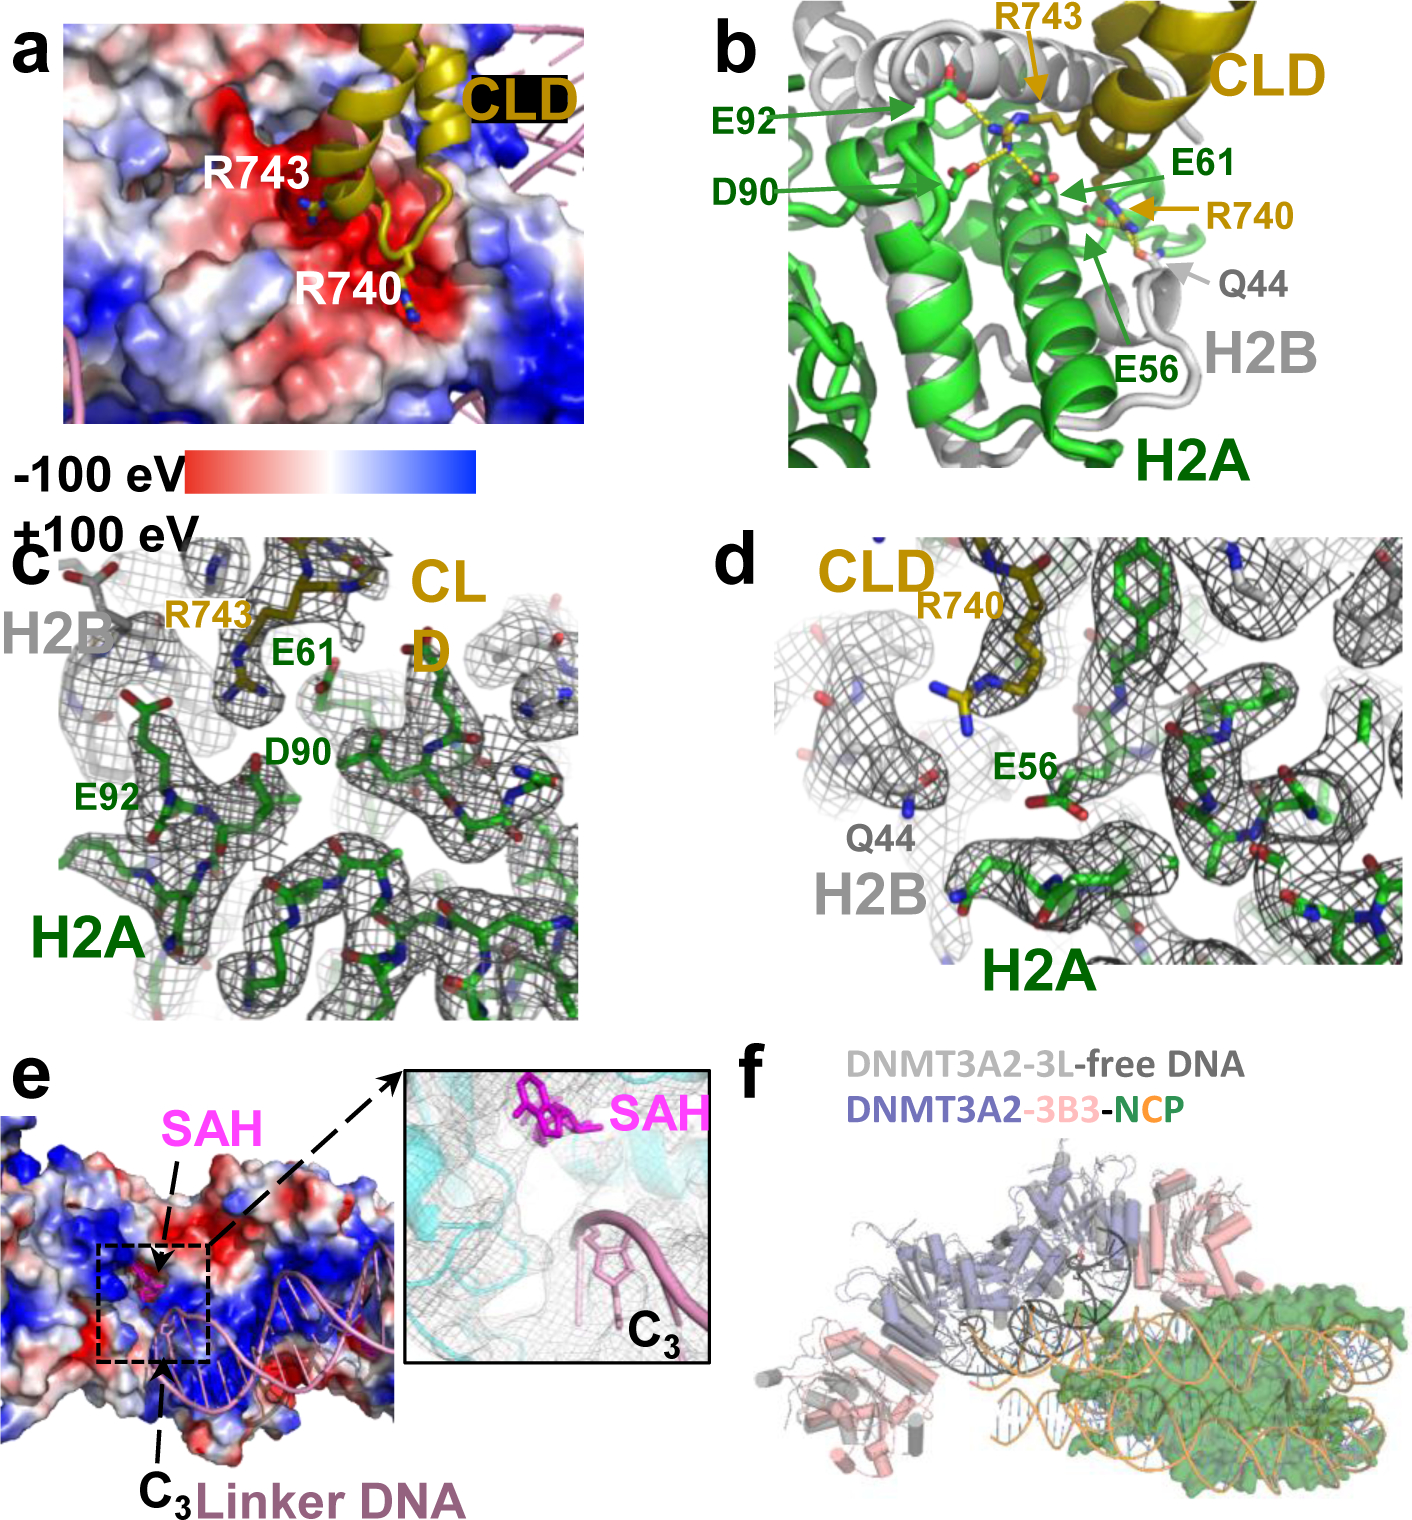
a, Two positively charged Arg fingers insert into negatively charged pockets of the acidic patch. The histone octamer in the acidic patch region is shown as charge potential map, nucleosomal DNA and the catalytic-like domain (CLD) loop as cartoon model with the two Arg fingers in stick representation. b, Close-up of the acidic patch interaction. Dashed lines indicate hydrogen-bonding interactions. c,d, Map density of DNMT3B3 R743 (c) and R740 (d) and their interacting residues in the acidic patch generated in PyMOL and contoured at 8 σ. e, Binding of linker DNA to the CD of DNMT3A2. CD: surface charge potential map; linker DNA: cartoon model; SAH and cytosine C3 of the CpG site near the catalytic center: stick presentation. Insert: close-up of catalytic center with cryo-EM density visualized in PyMOL and contoured at 8 σ. f, Structural overlay of NCP-bound DNMT3A2/3B3 with the crystal structure of free DNA-bound DNMT3A2/3L (5YX2).