
Extended Data Fig. 3. DNMT3A2/DNMT3B3 methylation activity and nucleosome interaction.
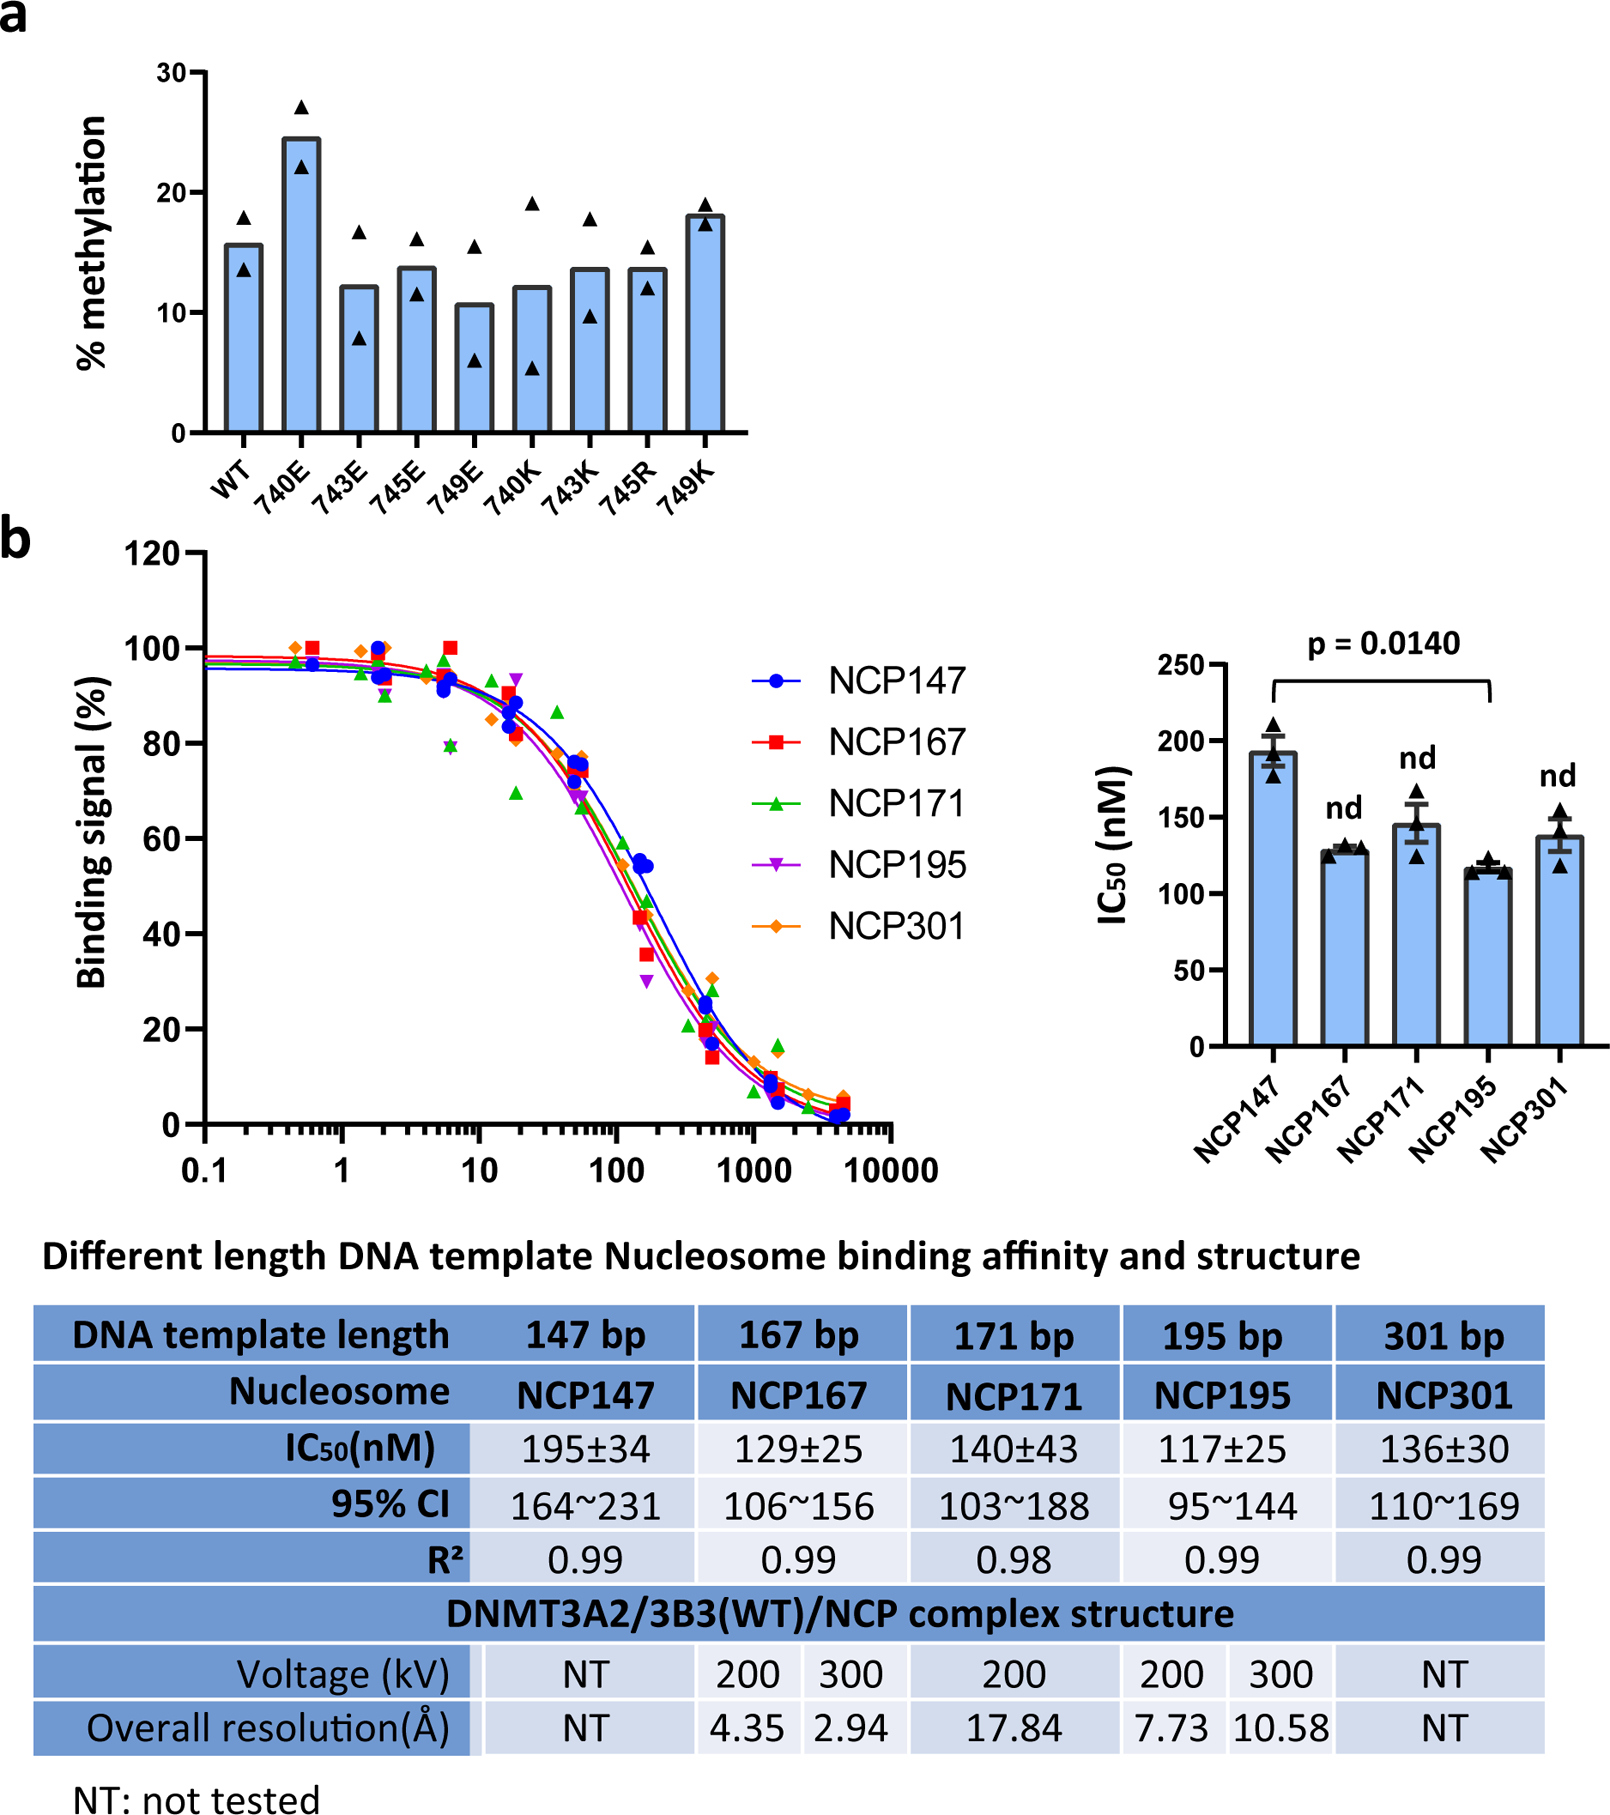
a, Free DNA methylation activity of acidic patch-interacting and control mutant DNMT3B3 proteins. Histone-free (naked) 301 bp nucleosomal DNA was incubated with the indicated DNMT3A2/3B3 complexes containing wildtype or mutant DNMT3B3. Shown is the percentage methylenation. Data are mean with individual values, n = 2. The total number of CpGs in the DNA is 24, of which a subset was preferentially methylated. b, Binding strength and structure resolution of DNMT3A2/3B3/NCP complexes with varying linker DNA lengths. Left: Competition binding curves. AlphaScreen interaction between biotin-NCPs and His6-tagged DNMT3A2/3B3 in the presence of increasing concentrations of untagged DNMT3A2/3B3. Data were generated from 3 independent experiments (n=3) and normalized in each group with highest data point as 100%. Right: IC50 calculated in each experiment and represented in bar graphs. Data are mean ± sem, n = 3, P values determined by non-parametric test with Dunn’s multiple comparisons test. The table below compares binding strengths (IC50) and cryo-EM resolution of DNMT3A2/3B3 complexes with NCPs containing different length DNAs. The 200-kV data were collected on a Talos Arctica microscope with a Falcon 3 detector, and 300 kV data on a Titan Krios microscope with a K2 detector.