
Extended Data Fig. 4. Overall structure of DNMT bound to the nucleosome.
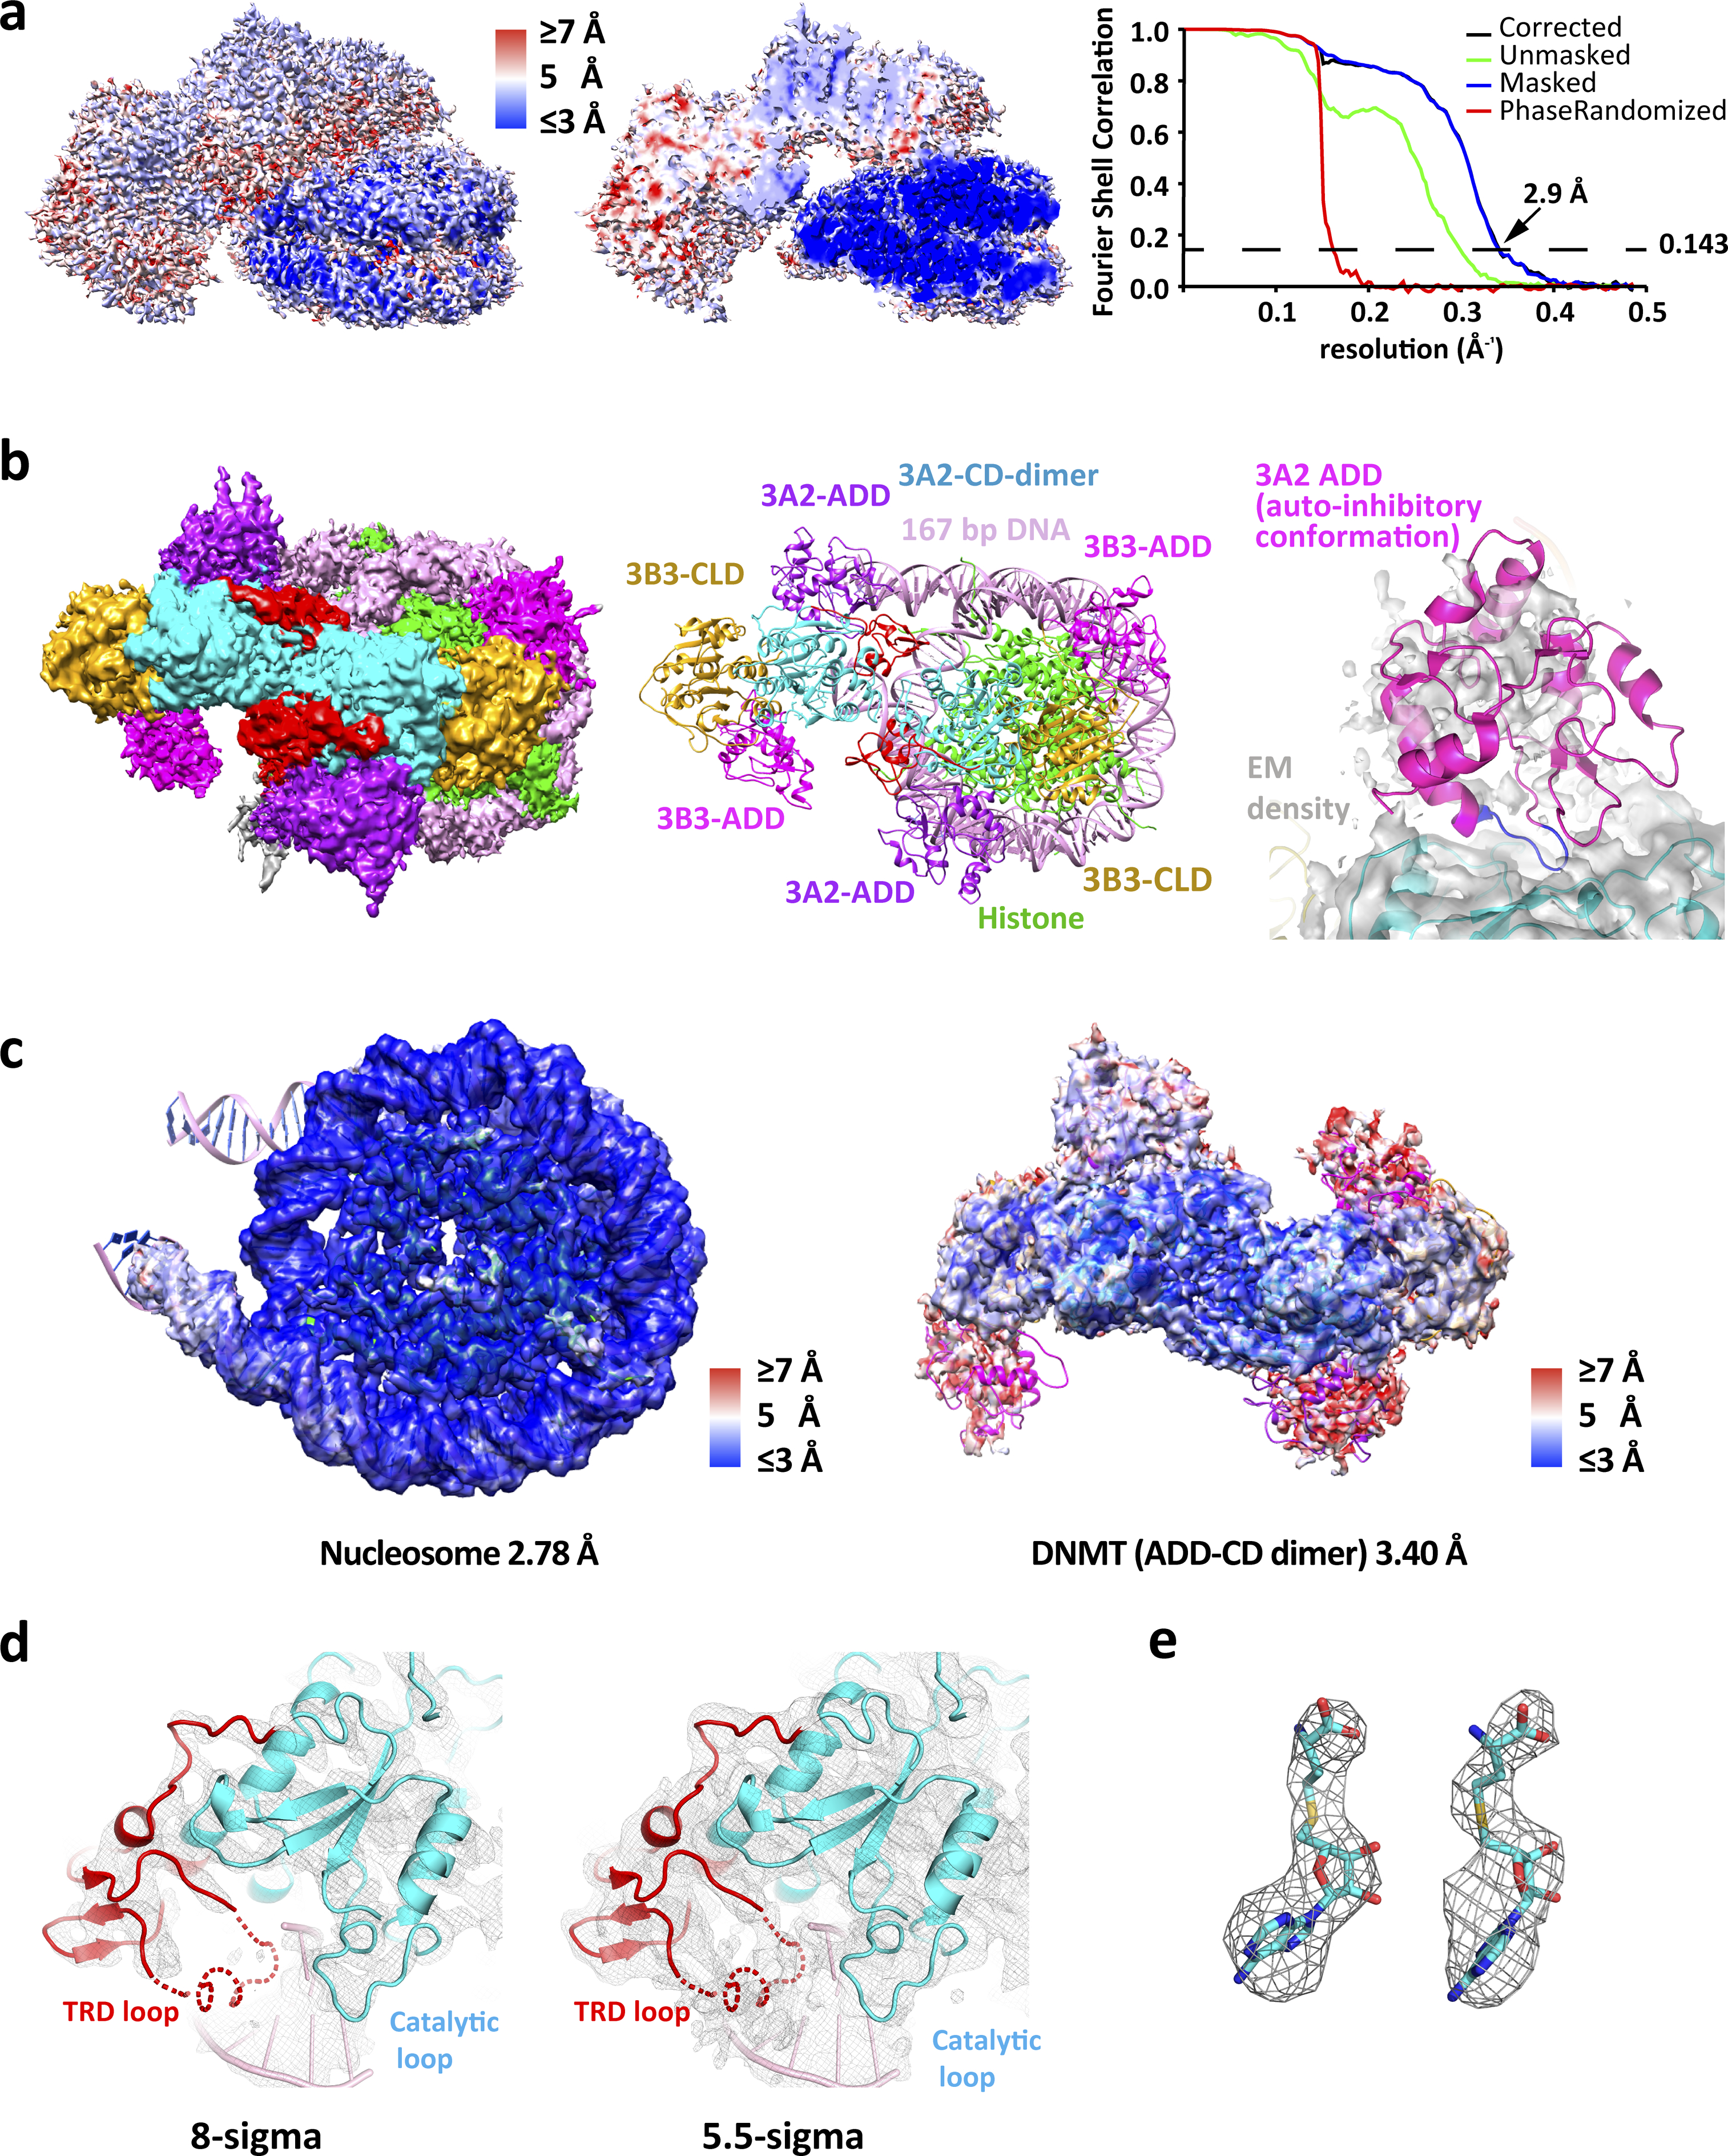
a, Local resolution map of DNMT-nucleosome core complex (global resolution of 2.94 Å) (left) and cut away view (middle). Corrected Fourier shell correlation (FSC) curves of the 3D reconstruction (right). b, Overview of DNMT-nucleosome complex with ADD domains (left) and cartoon representation (middle). Overlay of distal ADD EM density with aligned ADD in the auto-inhibitory conformation from PDB 4U7P. The inhibitory ADD loop 526–533 is highlighted in blue (right). c, Overall map fitting of the nucleosome, DNMT ADD-CD/CLD dimer and DNMT CD/CLD dimer with local resolution color code. The resolutions were determined using the 0.143 FSC criterion. d, Density map of the CD-DNA interaction region generated in PyMOL and contoured at 8 σ (left) and 5.5 σ (right). The dashed line indicates the position of the TRD loop that is only visible at the lower σ level and that we have omitted in the final model. e, Density maps of the two SAH ligands generated in PyMOL and contoured at 8 σ.