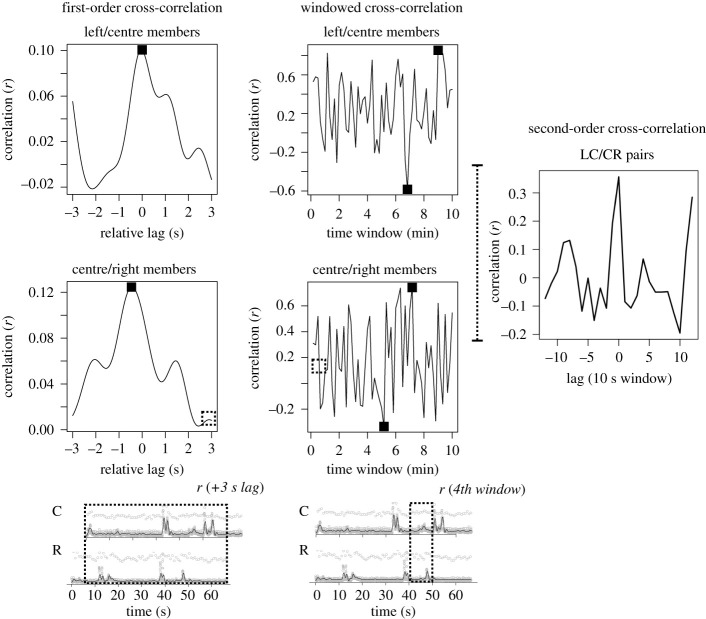
Figure 3.
On the left side is an aggregate reflection of correlation between two people, the cross-correlation function (triad #11). At lag of 0, if two people are on average correlated in their movement, then we will see maximum correlation. When it is shifted (illustrated below, with 3 s), this maximum should drop off as we lag the time series relative to each other. Black dots represent the dependent measures extracted for each pair: maximum correlation, minimum correlation, cross-correlation function maximum and its corresponding lag. On the right side, we show the ebb and flow of body correlation between two members of an example triad (#11). In windows of 10 s, the correlation can approach maximum (r = 1), and occasionally members of a triad show negative body correlation (r < 0). Next to that, the second-order measure of triadic synchrony was based on the cross-correlation function of these two time series. This assesses whether a triad's component dyads covary in synchrony.

