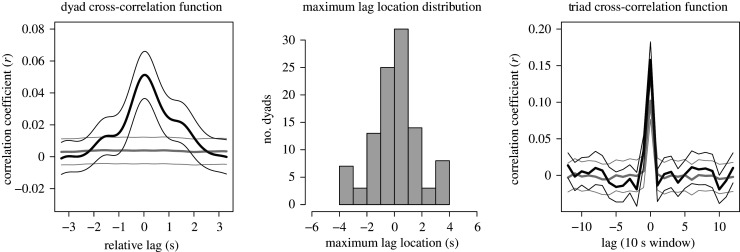
Figure 4.
On the left, the average cross-correlation function for observed data (black), with narrower lines reflecting standard error (using conservative d.f. = Ntriads – 1 = 34). At its peak, this function shows a significantly greater value than the surrogate pairs, shown in grey. In the middle, the distribution, across dyads, of the lag where the maximum cross-correlation is observed (N = 35 triads × 3 pairs = 105 dyadic observations). On the right, the cross-correlation function of the triads, based on how correlation among the pairs changes over time. In a narrower effect near the lag of 0, triads show higher relative correlation.

