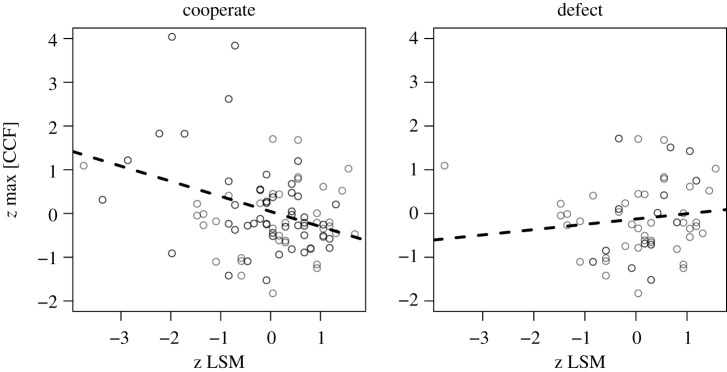
Figure 5.
To unpack the interaction, we observe in the follow-up model, we plot separately those individuals who cooperated (left) versus defected (right) with their partner. Defections tend to correspond to a line that suggests too little/too much similarity. Cooperation falls on a line that suggests a trade-off, especially for a number of subjects who exhibited strong body synchrony with their partners.

