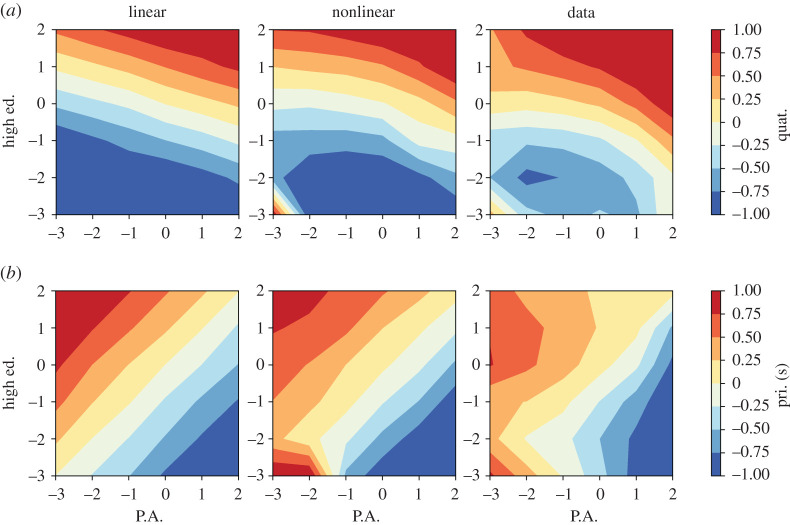
Figure 2.
Rescaled indicators for Jobs in Quaternary Sector (a) and Jobs in Primary and Secondary Sectors (b) as functions of the rescaled indicators for Jobs in Public Administration (x-axis) and Fraction of highly educated people (y-axis). Areas in red (blue) represent communes with a large (small) value of the rescaled indicator used as dependent variable. The first column (with the label linear) reports the results obtained with the Hamiltonian model without the terms J(1) and J(3). The second column (with the label nonlinear) reports the results obtained with the complete model of equation (2.3). The last column reports the results obtained by binning the points for the communes in the year (2012).

