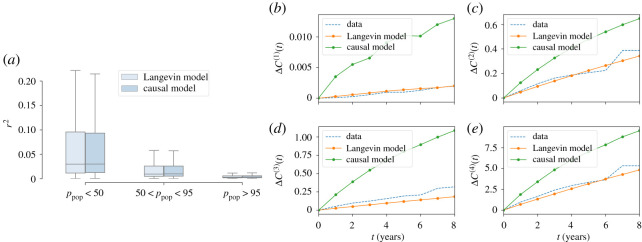
Figure 6.
(a) Distribution of r2 computed according to equation (2.7) and with a causal inference model, inferred using temporal information explicitly. The values of r2 have been divided according to the percentile of the commune population distribution. (c,b,d,e) Evolution of the distance between macroscopic observables computed in different years with respect to those computed in 2012 (t = 0 on the x-axis).

