Figure 3.
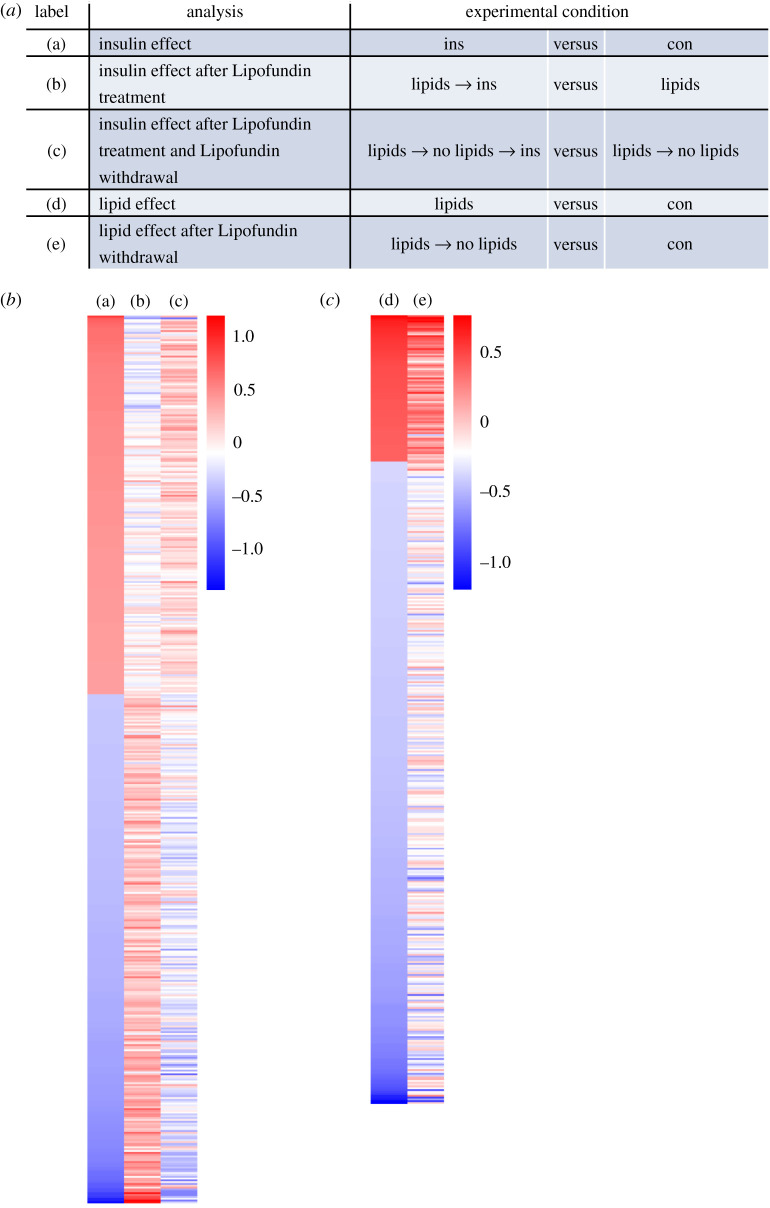
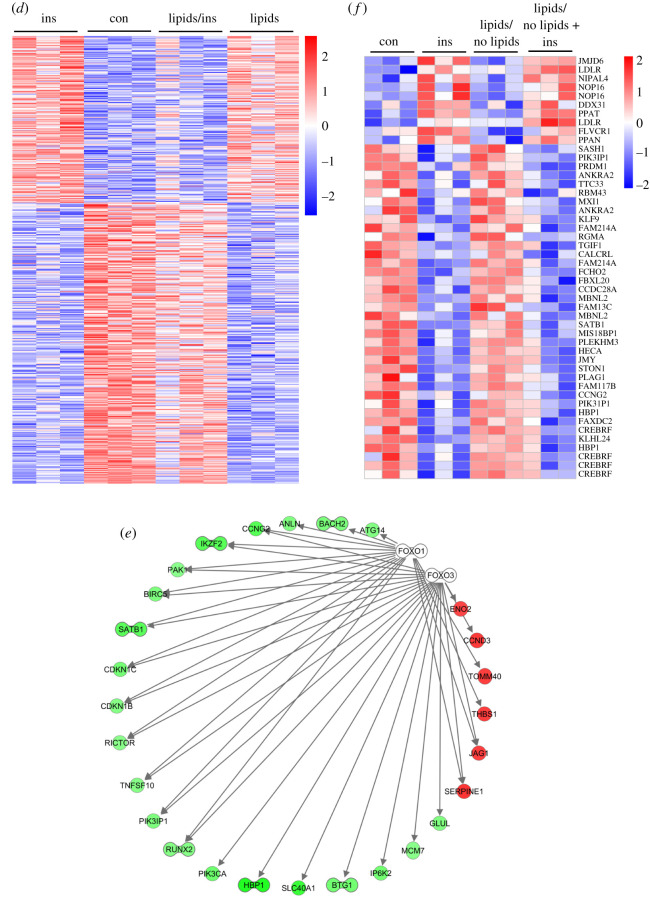
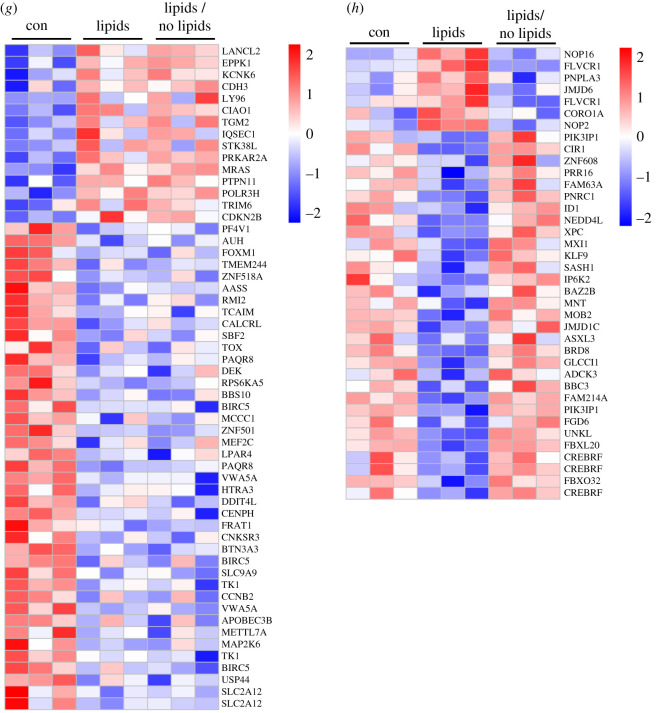
Lipofundin treatment alters gene expression profile in human astrocytes. (a) Depiction of analysis. (b) Heatmap representing the regulation of 485 genes based on comparison (a). (c) Heatmap showing 431 genes regulated in the comparison (d). (d) 535 genes with inverse regulation between ins and lipids + ins. (e) Predicted targets of FOXO1 and FOXO3 among this set of 535 genes shown in (d) Red (green) indicates up (down)-regulation by the presence of Lipofundin and bar-bell-shaped icons indicate transcription factors. (f) Forty-eight genes were regulated in the same direction in the two analyses ins versus con and lipids → no lipids → ins versus lipids → no lipids. (g,h) The comparison of the two analyses lipids versus con and lipids/no lipids versus con revealed genes, which are either not reversible (g, 56 genes) or reversible (h, 38 genes) upon lipid withdrawal. Gene expression is presented as ratios (b,c) or as absolute expression values (d–g). Scale bar indicates upregulation (red) or downregulation (blue).


