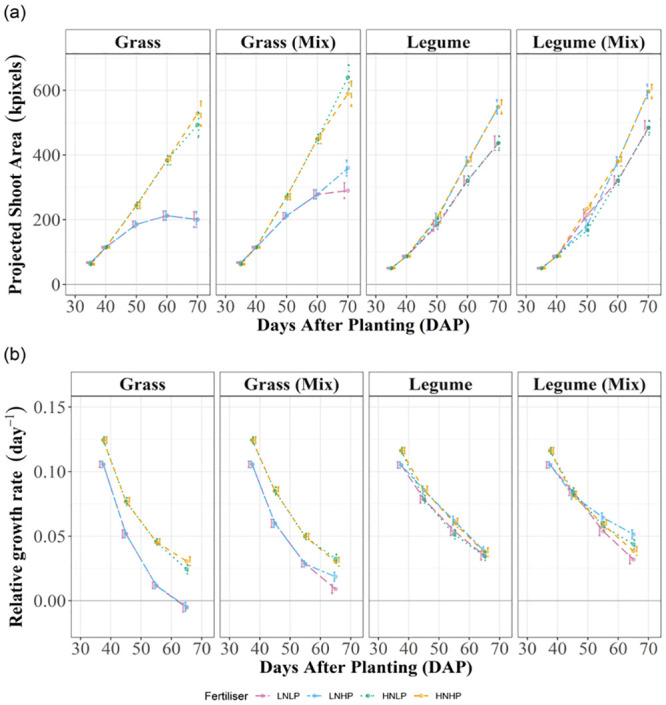
Fig 3. Tables of estimated marginal means.

a) Estimated marginal means for AG (sPSA DAP 70, kpixels) and b) RGR (day-1) by species (Eq 1), cultivation and nutrient treatment with half-least significant difference (5%) error bars. Non-overlapping error bars indicate significant differences. Purple = LNLP, Yellow = HNHP, Green = HNLP, Blue = LNHP.
