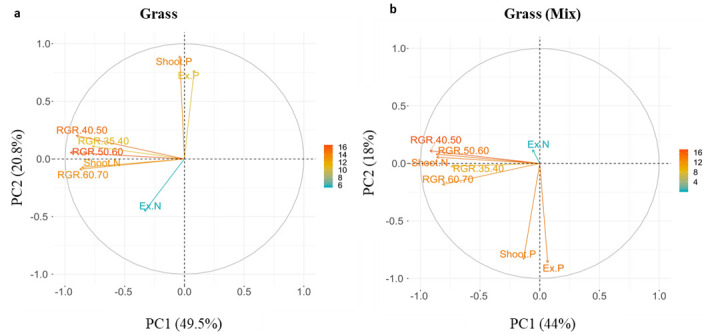
Fig 4. PCA loading plot of the first two principal components for a) grasses in monoculture and b) grasses in mixture.

Gradient colour scales and arrow length represent the percentage of variation explained by each variable along the principal component. RGR 35–70 = Relative growth rate (kpixels day-1), Ex P = Extractable P (mg g-1), Ex N = Extractable N (mg g-1), Shoot P = Shoot P (mg g-1), Shoot N = Shoot N (mg g-1).
