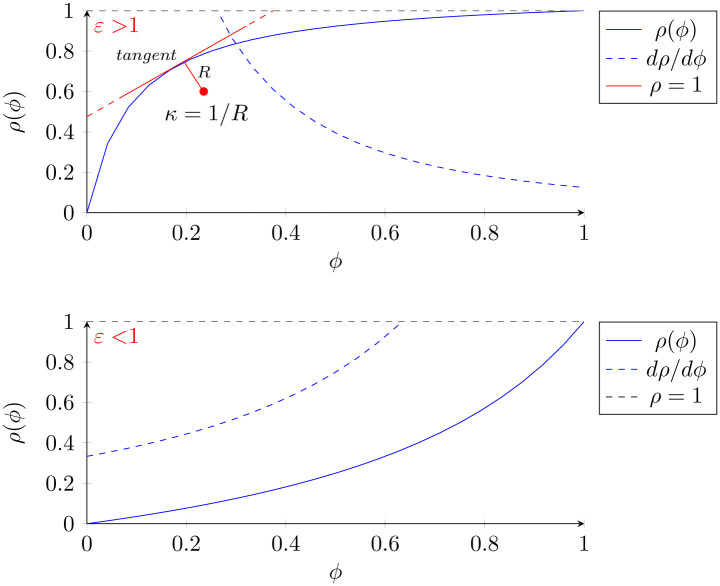
Fig 2. The first graph represents scenarios where ε > 1.
We denote the line tangent to the point of maximum curvature κ from which we derive the radius of curvature R, perpendicular to it. The second graph represents the more rare scenarios where ε < 1. The sensitivity and specificity are constant and were randomly chosen to satisfy the ε condition.

