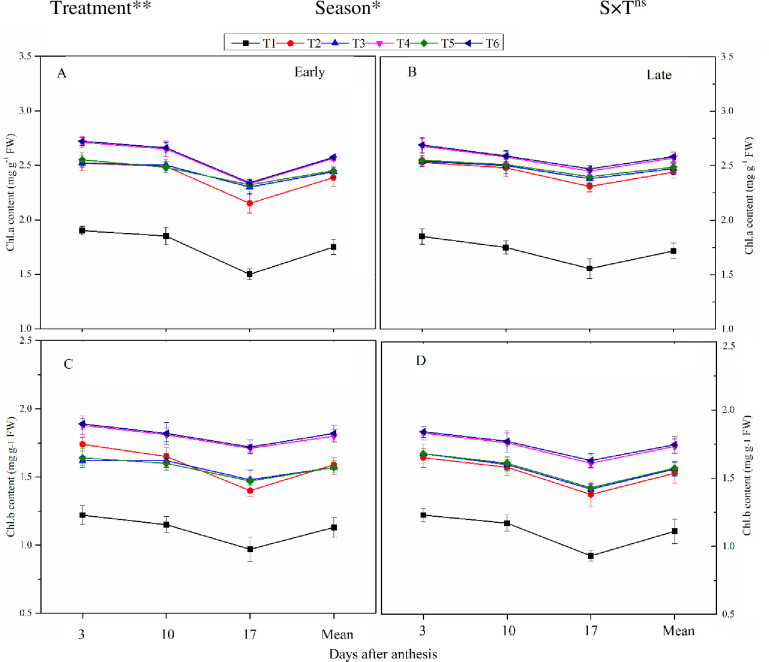
Fig 3.
Changes in flag leaf chlorophyll content a and b (3, 10, and 17 days after anthesis—DAA) during grain-filling at the early (A, C) and late (B, D) season under the combined organic and inorganic N fertilization. Vertical bars represent the standard error of means. Note. Chl.a—Chlorophyll a, Chl.b—Chlorophyll b, FW—Fresh leaf weight. The treatment coding details already showed in the above figure. The mean comparison was made using Tukey tests for treatments mean in both seasons and the lettering was done on basis of Tuky HSD test at 5% using simple effect. ns = non-significant; *, ** = significant at 5% and ** at 1%, respectively.

