
Fig 2. Kaplan-Meier curves for OS of CC patients.
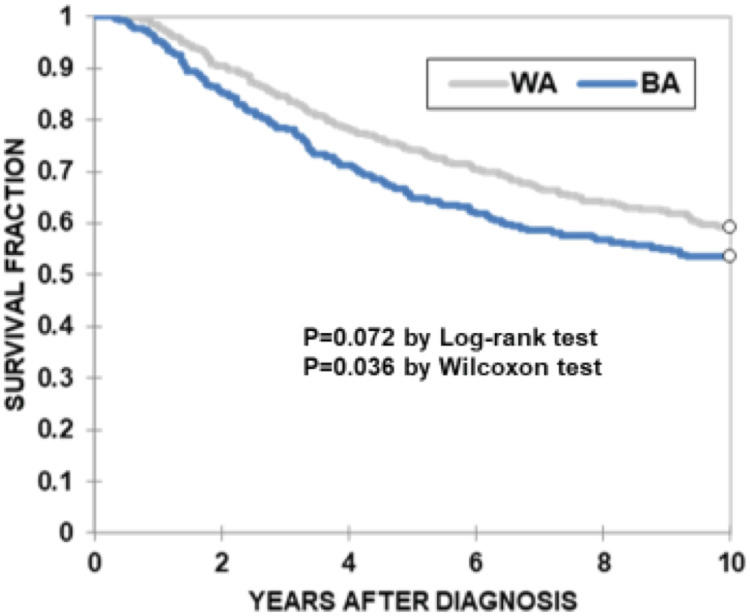
OS was compared between BA (blue line, n = 293) and WA (gray line, n = 348) CC patients. The X-axis represents years of OS after diagnosis. The Y-axis represents survival percentage. P values were determined by log-rank test (p = 0.072) or Wilcoxon test (p = 0.036).