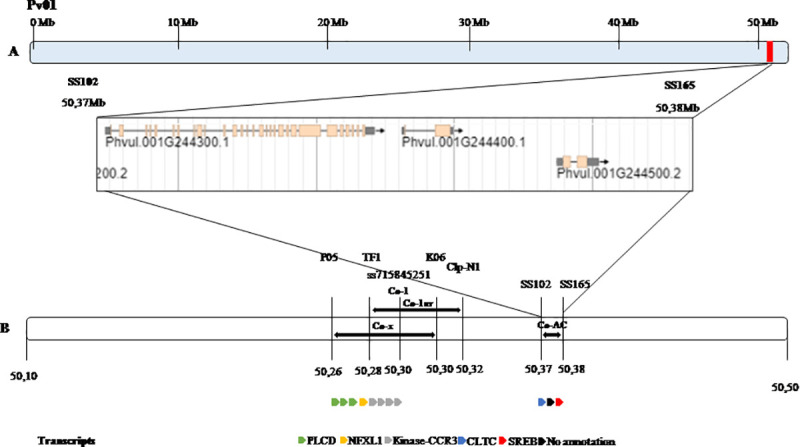
Fig 2. Fine mapped region for Amendoim Cavalo resistance locus Co-AC.

Fig 2A. Chromosome Pv01 with Co-AC region highlighted in red at the end of the chromosome. Three predicted genes are within Co-AC region flanked by the markers SS102 and SS165. Fig 2B. Comparison between the physical position (Mb) of the Co-AC locus, Co-x [33], Co-1, and Co-1HY [8] and predicted transcripts for each gene region. Color codes represent predicted gene functions. Orange represent phosphatidylinositol phospholipase C, delta (PLCD) protein, purple represent NF-X1 type zinc finger protein (NFXL1), green represent serine/threonine-protein kinase- like protein CCR3-related protein (Kinase-CCR3), blue represent clathrin heavy chain protein (CLTC), red represent sterol regulatory element binding protein (SREB) and black represent protein with unknown function. The genomic region between these markers is indicated by the lower bar and cover around 9,45 Kbp of the genome.
