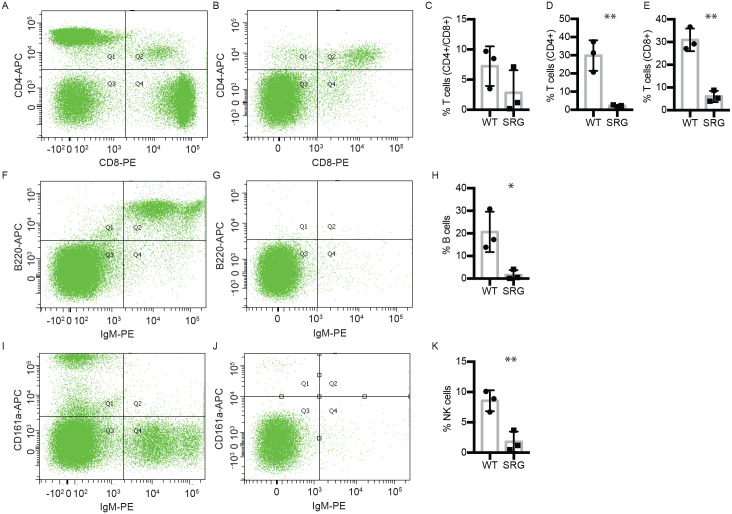
Fig 2. Immunophenotyping of peripheral blood.
Flow cytometry dot plots show representative data from one WT and one SRG rat each. A-E) T cells in peripheral blood in A) wild-type rat and B) SRG rat. C-E) Quantification of data T cell populations, n = 3, error ±SD. (Unpaired t-test, p-values: ** < 0.01). T cells are significantly reduced in peripheral blood of the SRG rat (B; 1.6% CD4+, 5.3% CD8+, 1.2% CD4+/CD8+) compared to wild-type rat (A; 37.4% CD4+, 36.6% CD8+, 3.5% CD4+/CD8+). F-H) Circulating mature B cells in F) wild-type rat and G) SRG rat. The SRG rat is completely devoid of circulating mature B cells (G) compared to wild-type (F). H) Quantification of data, n = 3, error ± SD. (Unpaired t-test, p-values: * < 0.05). I-K) NK cells in the I) wild-type rat (10.1% CD161a+) and J) SRG rat (0.5% CD161a+). K) Quantification of data, n = 3, error ± SD. (Unpaired t-test, p-values: ** <0.01). Compared to NK cells in the wild-type rat (I; 10.1% CD161a+), the SRG rat has significantly reduced circulating NK cells (J; 0.5% CD161a+).

