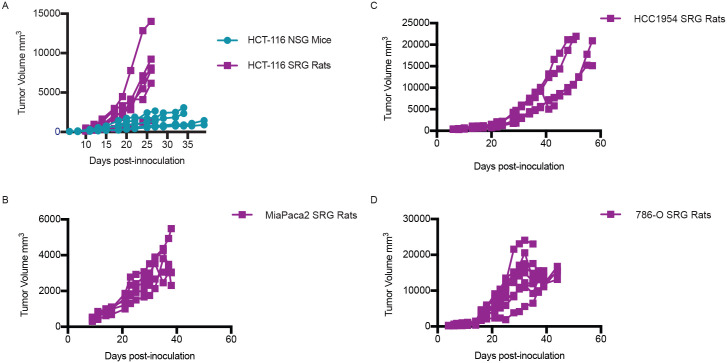
Fig 3. Xenograft models in the SRG rat and NSG mouse.
A) Tumor growth curve in NSG mice and SRG rats inoculated with 2x10⁶ HCT-116 cells subcutaneously in the hind flank. Tumor width and length were measured three times weekly to calculate volume. B) Tumor growth curve in SRG rats inoculated with 5 x10⁶ MIA-PaCa-2 cells. C) Tumor growth curve in SRG rats inoculated with 5 x10⁶ HCC1954 cells. D) Tumor growth curve in SRG rats inoculated with 10 x106 786-O cells.

