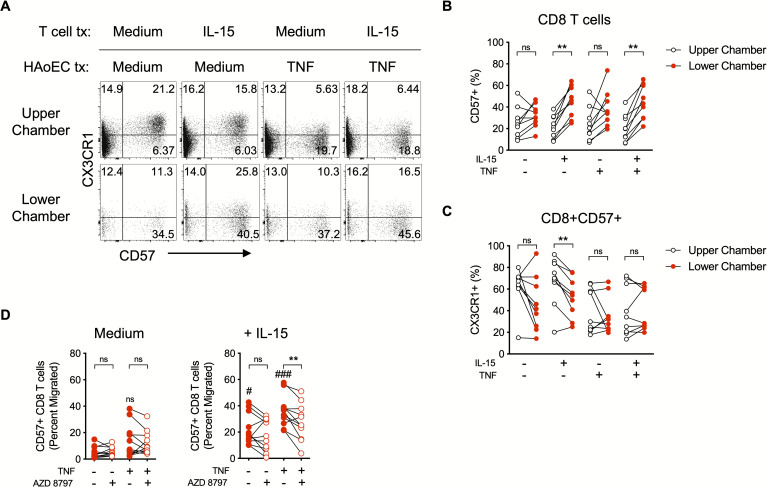
Fig 6. Chemoattraction of activated CX3CR1+ CD8 T cells to an endothelial cell monolayer.
(A) Representative dotplots showing CX3CR1 and CD57 expression on CD8 T cells. (B) Percentage of CD8 T cells in each chamber expressing CD57. (C) Percentage of CD57+ CD8 T cells in each chamber expressing CX3CR1. (D) Absolute number of CD57+ CD8 T cells in the lower chamber expressed as a percent of total (upper chamber + lower chamber) CD57+ CD8 T cells (“Percent migrated”) pre-treated with medium control (left) or IL-15 (right). Actual numbers of cells recovered in the assay are depicted in S5 Fig. (B-D) Differences between groups were determined by Wilcoxon rank sum test: *P ≤ 0.05; ns, not significant. HAoECs, human aortic endothelial cells; tx, treatment.

