
Figure 3: BX795 blocks the synthesis of HSV-1 virions.
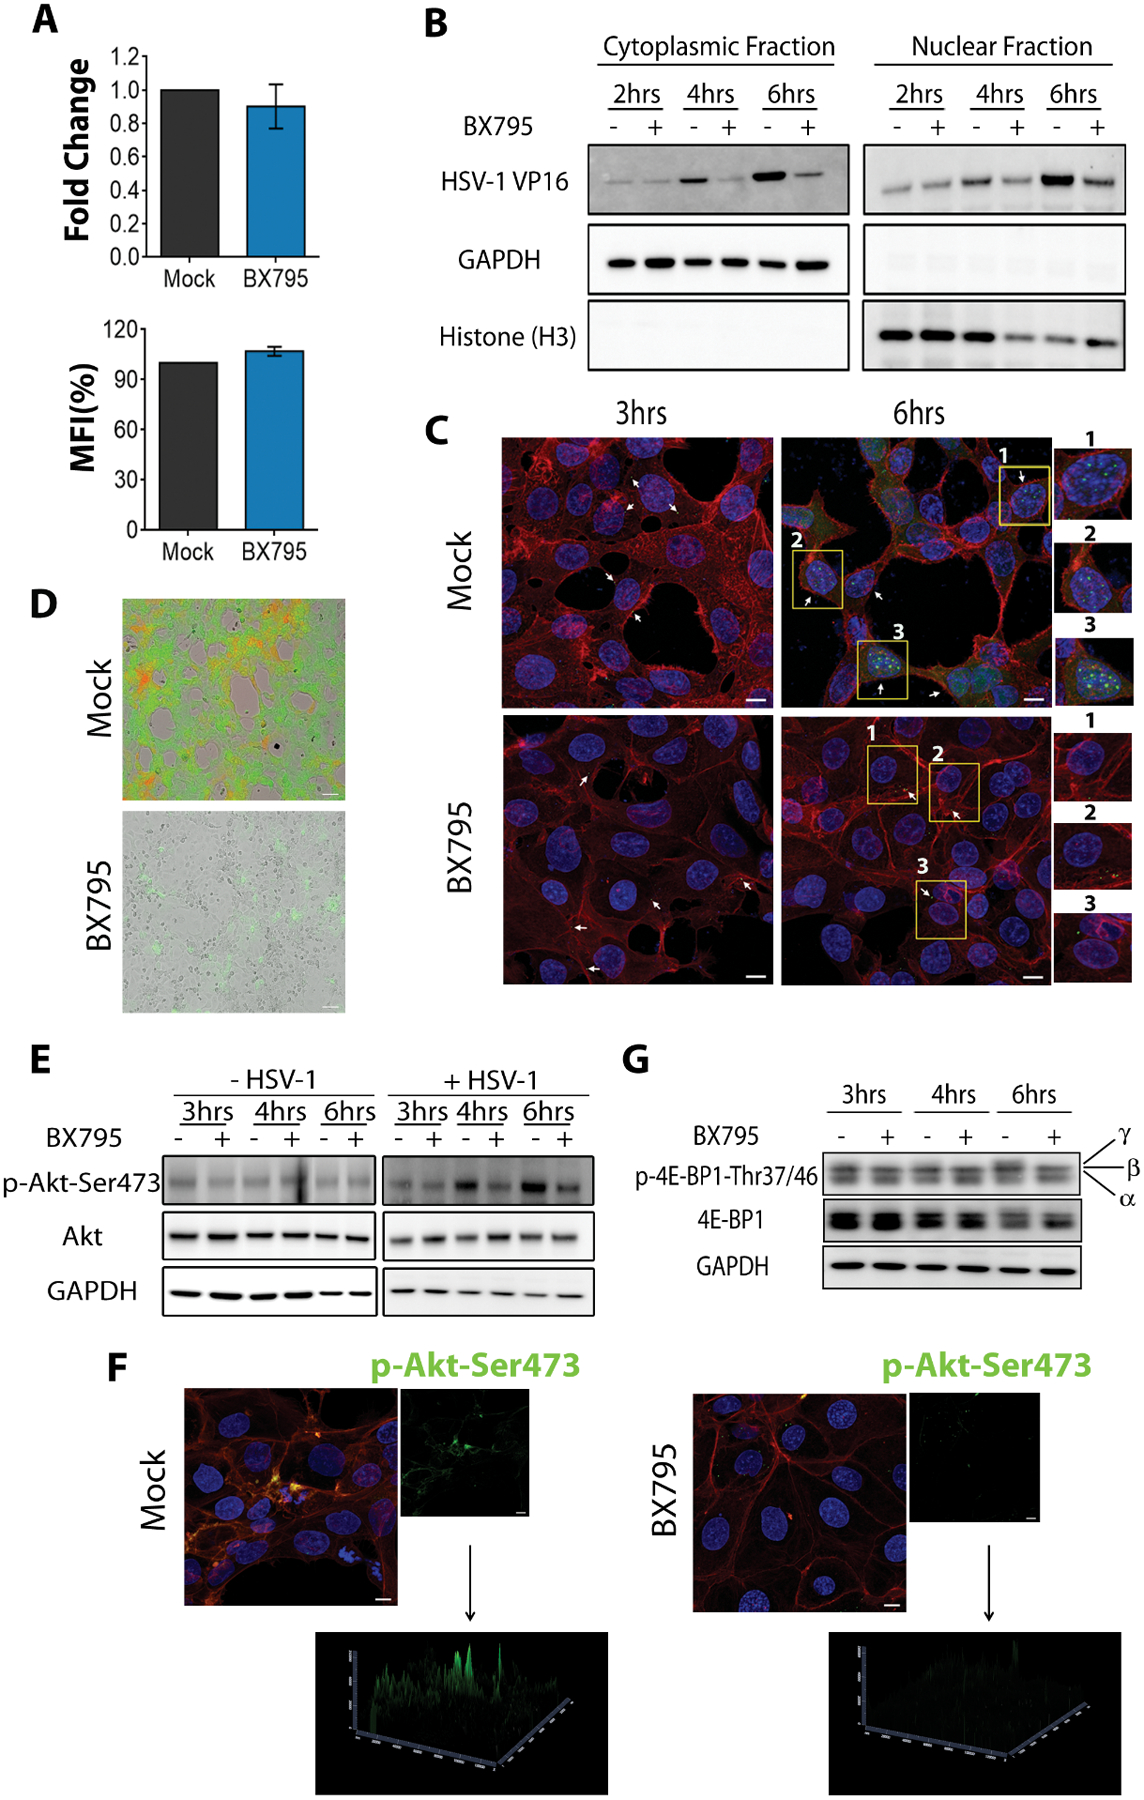
(A) HSV-1 viral entry in the presence and absence of BX795 assessed by qPCR (left panel) and flow cytometry (right panel). HCE cells were infected with MOI 5 HSV-1(KOS). Mock or BX795 (10 μM) treatments were added along with the virus. At 2 hpi, the cells were collected and genome levels were detected by qPCR. For flow cytometry, HCE cells were infected with MOI 1000 HSV-1(K26GFP). Mock or BX795 (10 μM) treatments were added along with the virus. At 45 minutes post-infection, the cells washed and processed for flow cytometry. Data (n=3 replicates) is represented as percentage of mock-treated MFI. (B) Immunoblots of HSV-1 VP16, human GAPDH and human histone H3 in the organelle fractions of infected HCE cells. HCE cells were infected with MOI 5 HSV-1(KOS) and 15 minutes later, mock or BX795 (10 μM) treatments were added. The cells were collected at the indicated times and fractioned. The lysates were then electrophoresed to detect HSV-1 VP16, human GAPDH and human histone H3. The numbers shown below the blot are the intensities of the VP16 band relative to GAPDH in the cytoplasmic fraction and relative to H3 in the nuclear fracion. (C) Representative confocal microscopy images of infected and mock-treated or BX795-treated HCE cells indicating the presence of virus (green, white arrows) at different times post-infection. The cells were infected with MOI 5 HSV-1(K26GFP) with or without BX795 (10 μM) and at the indicated times actin (red) and the nuclei (blue) were stained and imaged under 63x objectives. Magnified images of the cells highlighted in yellow boxes and labeled with numbers, for each treatment, are shown on the right. Scale bar: 10 μm. (D) Representative images showing the presence of ICP0-GFP (green) and gC-RFP (red) HSV-1 in the mock and BX795-treated HCE cells. The cells were infected with MOI 0.1 dual-fluorescent HSV-1(KOS) after which the mock and BX795 (10 μM) treatments were added. The cells were imaged 24 hpi. Scale bar: 100 μm. (E) Immunoblots of the total and phosphorylated Akt and human GAPDH in non-infected and infected HCE cell lysates. The cells were either non-infected or infected with MOI 5 HSV-1(KOS) and at 2 hpi, fresh culture medium containing the mock or BX795 (10 μM) treatments were added to both the non-infected and the infected cells. At the indicated times, the cells were collected and the lysates were electrophoresed. The numbers shown below are the intensities of the p-Akt band relative to GAPDH. (F) Representative confocal images of phosphorylated Akt in the infected and mock- or BX795-treated HCE cells. The cells were infected as in (E) and at 6 hpi, the cells were stained for actin (red), nuclei (blue) and phosphorylated-Akt (green) and imaged under 63x objectives. Scale bar: 10 μm. (G) Immunoblots of the total and phosphorylated 4E-BP1 in infected HCE cell lysates. The cells were infected as in (E) and at the indicated times, cells were collected and the lysates were electrophoresed. α, β and γ indicate the phosphorylation status of 4E-BP1 with γ being hyper-phosphorylated. Representative blots from three replicates are shown.