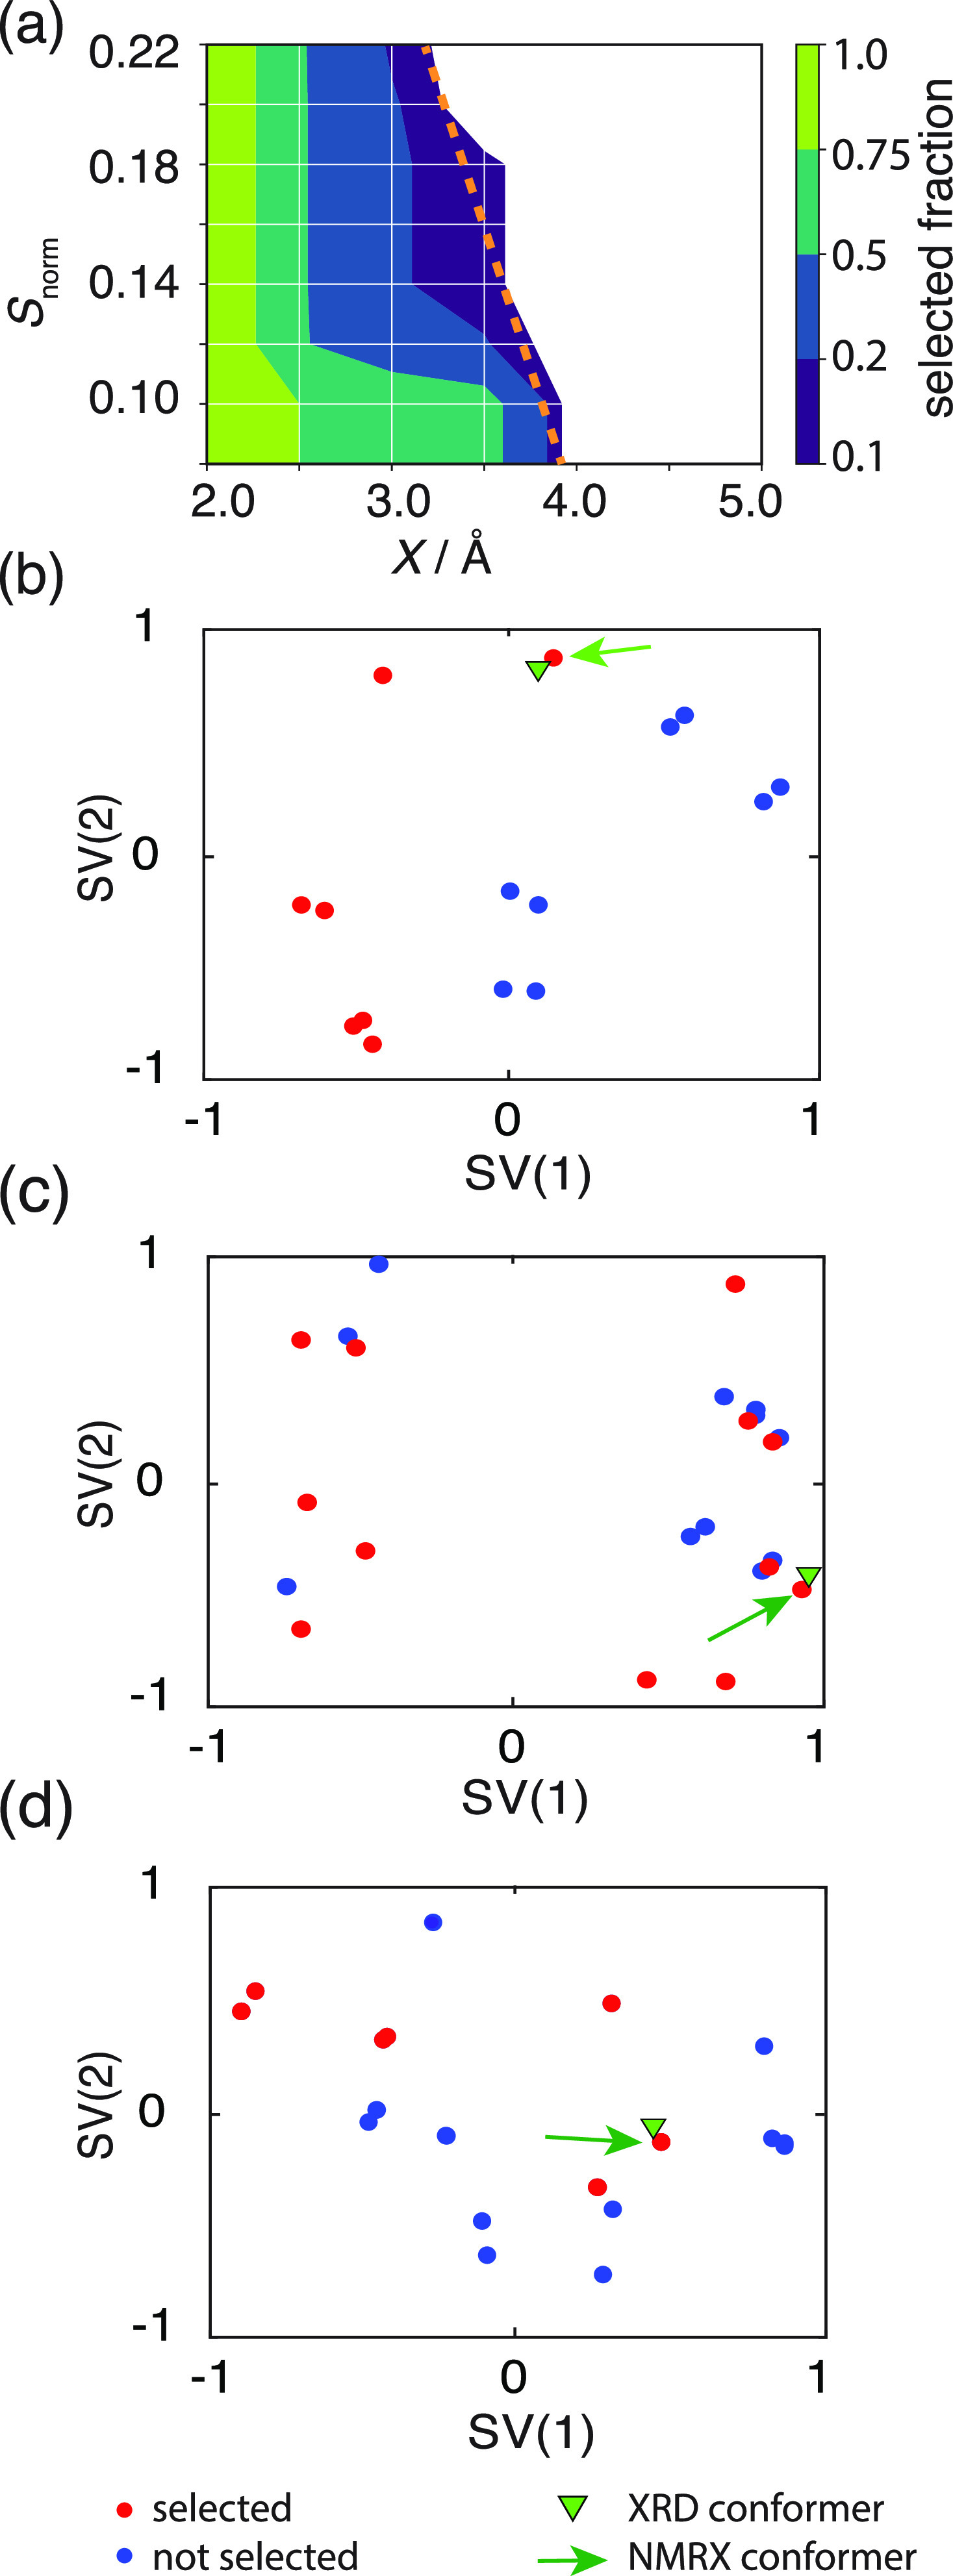
Figure 3.

(a) Grid search results of the threshold distance X and Snorm cutoff values for flutamide, cocaine, and flufenamic acid. The color-map shows the percentage of selected structures from within the conformer ensemble. The white area indicates the region where the correct conformer is not selected. Optimal selection parameters should select the smallest conformer ensemble that still contains the correct structure. This corresponds to the dark blue regions within the different panels. The dashed orange line denotes the boundary at which the selection process starts to fail. (b–d) Conformer selection for flutamide (b), flufenamic acid (c), and cocaine (d). The panels show the sketch-map projections of the gas-phase ensembles. Red dots represent the structures that are selected where a threshold distance X of 3.5 Å and an Snorm cutoff value of 0.14 were used. The green triangle shows the conformer found in the XRD-generated crystal structure. The green arrow points to the gas-phase conformer which results in the correct crystal structure after the CSP procedure.
