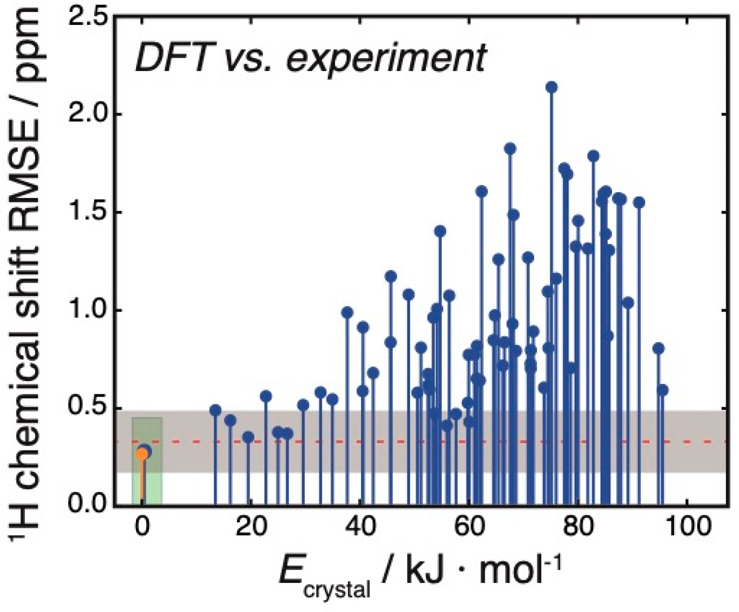
Figure 6.

Comparison of crystal structure candidates. The structures are sorted according to their relative lattice energy, as specified on the horizontal axis. The vertical axis shows 1H chemical shift RMSE between DFT-calculated and experimental chemical shifts. The orange marker shows the 1H chemical shift RMSE for the single-crystal XRD structure. The red line shows the mean of the expected difference between experimental and DFT-calculated 1H chemical shifts, with the distinguishability limits (at the 1σ level) indicated as the gray shaded zone, as described in the main text.
