Figure 3.
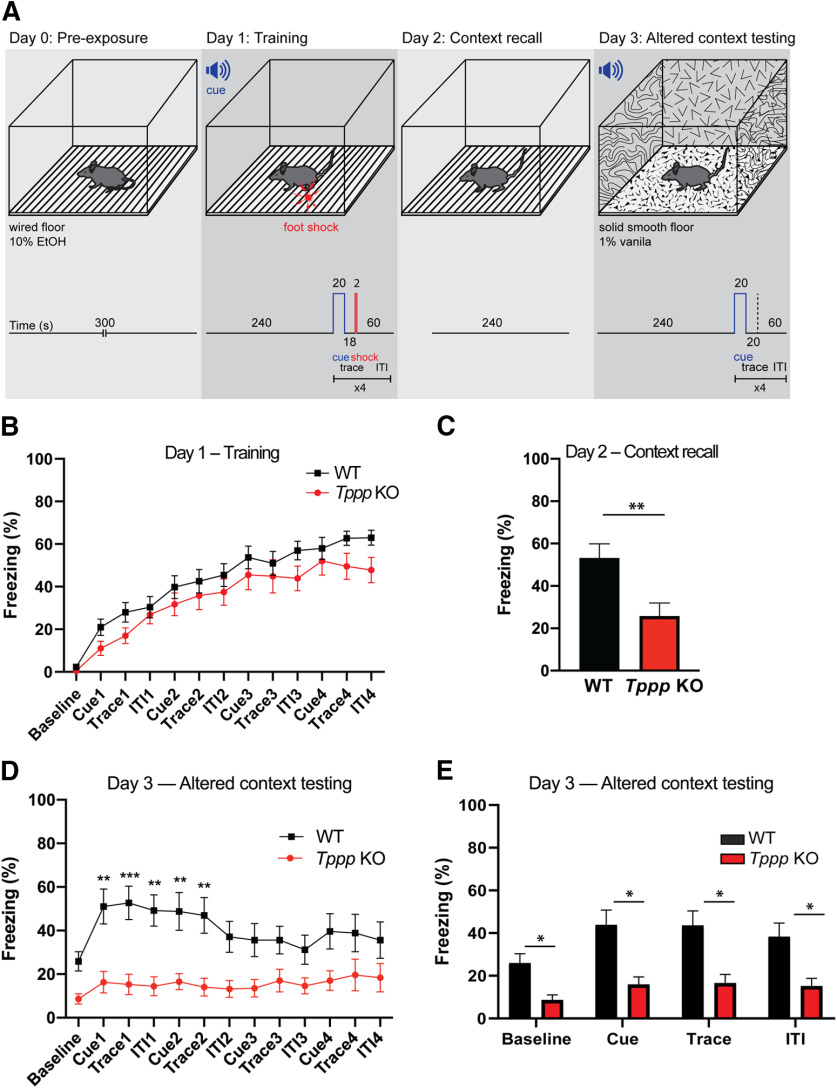
Tppp KO mice display defective fear conditioning. A, Fear conditioning assay experimental design. On day 0, mice were acclimated to a wired-floor cage with a background scent of 10% ethanol. On day 1, the mice were again acclimated to the cage and then a cue sound was played for 20 s followed by a foot shock and a 60-s ITI. The cue, trace, shock, and ITI were repeated for a total of four times. On day 2, mice were placed in the same wired floor cage with 10% ethanol scent. On day 3, mice were acclimated to a cage with solid smooth flooring and 1% vanilla background scent and then given the cue sound, without the shock; n = 11 mice per genotype for all data in this figure. Detailed statistical results can be found in Extended Data Figure 3-1; power analyses can be found in Extended Data Figures 1-2, 2-2. B, On day 1 (training), Tppp KO mice had similar freezing responses as wild-type mice, with no significant differences in percentage time spent freezing when evaluated by two-way ANOVA with post hoc Sidak’s multiple comparisons test. Graphs represent significance based on two-way ANOVA with post hoc Sidak’s multiple comparisons test. Evaluating wild-type versus Tppp KO means as independent t tests (i.e., at different time points/periods) gives p values of 0.371 (wild type: 2.306%, Tppp KO: 0.472%) at baseline and of 0.042 (wild type: 62.94%, Tppp KO: 47.79%) during ITI4 (p = 0.042). All other p values generated by independent t tests were >0.05. C, On day 2 (context recall), Tppp KO mice displayed less freezing overall compared with wild-type mice. p = 0.007 by Welch’s t test. D, On day 3 (context recall), Tppp KO mice displayed significantly less freezing than wild-type mice at all timepoints during the first two rounds of training. Graphs represent significance based on two-way ANOVA with post hoc Sidak’s multiple comparisons test. Evaluating wild-type versus Tppp KO means as independent t tests (i.e., at different time points/periods) reveals significant p values for all other timepoints except trace 3: at baseline, p = 0.0014 (wild type: 24.74%, Tppp KO: 8.650%); for cue 3, p = 0.0213 (wild type: 35.65%, Tppp KO: 13.55%); for trace 3, p = 0.0634 (wild type: 35.64%, Tppp KO: 17.06%); for ITI 3, p = 0.0473 (wild type: 31.21%, Tppp KO: 14.60%); for cue 4, p = 0.0269 (wild type: 39.66%, Tppp KO: 17.03%); for trace 4, p = 0.0294 (wild type: 38.85%, Tppp KO: 19.64%); for ITI 4, p = 0.0320 (wild type: 35.63%, Tppp KO: 18.36%). E, On day 3, Tppp KO mice displayed significantly less freezing during baseline, cue, trace, and ITI periods than wild-type mice; p values calculated by two-way ANOVA. Error bars represent SEMs. *p < 0.05, **p < 0.01, ***p < 0.001.

