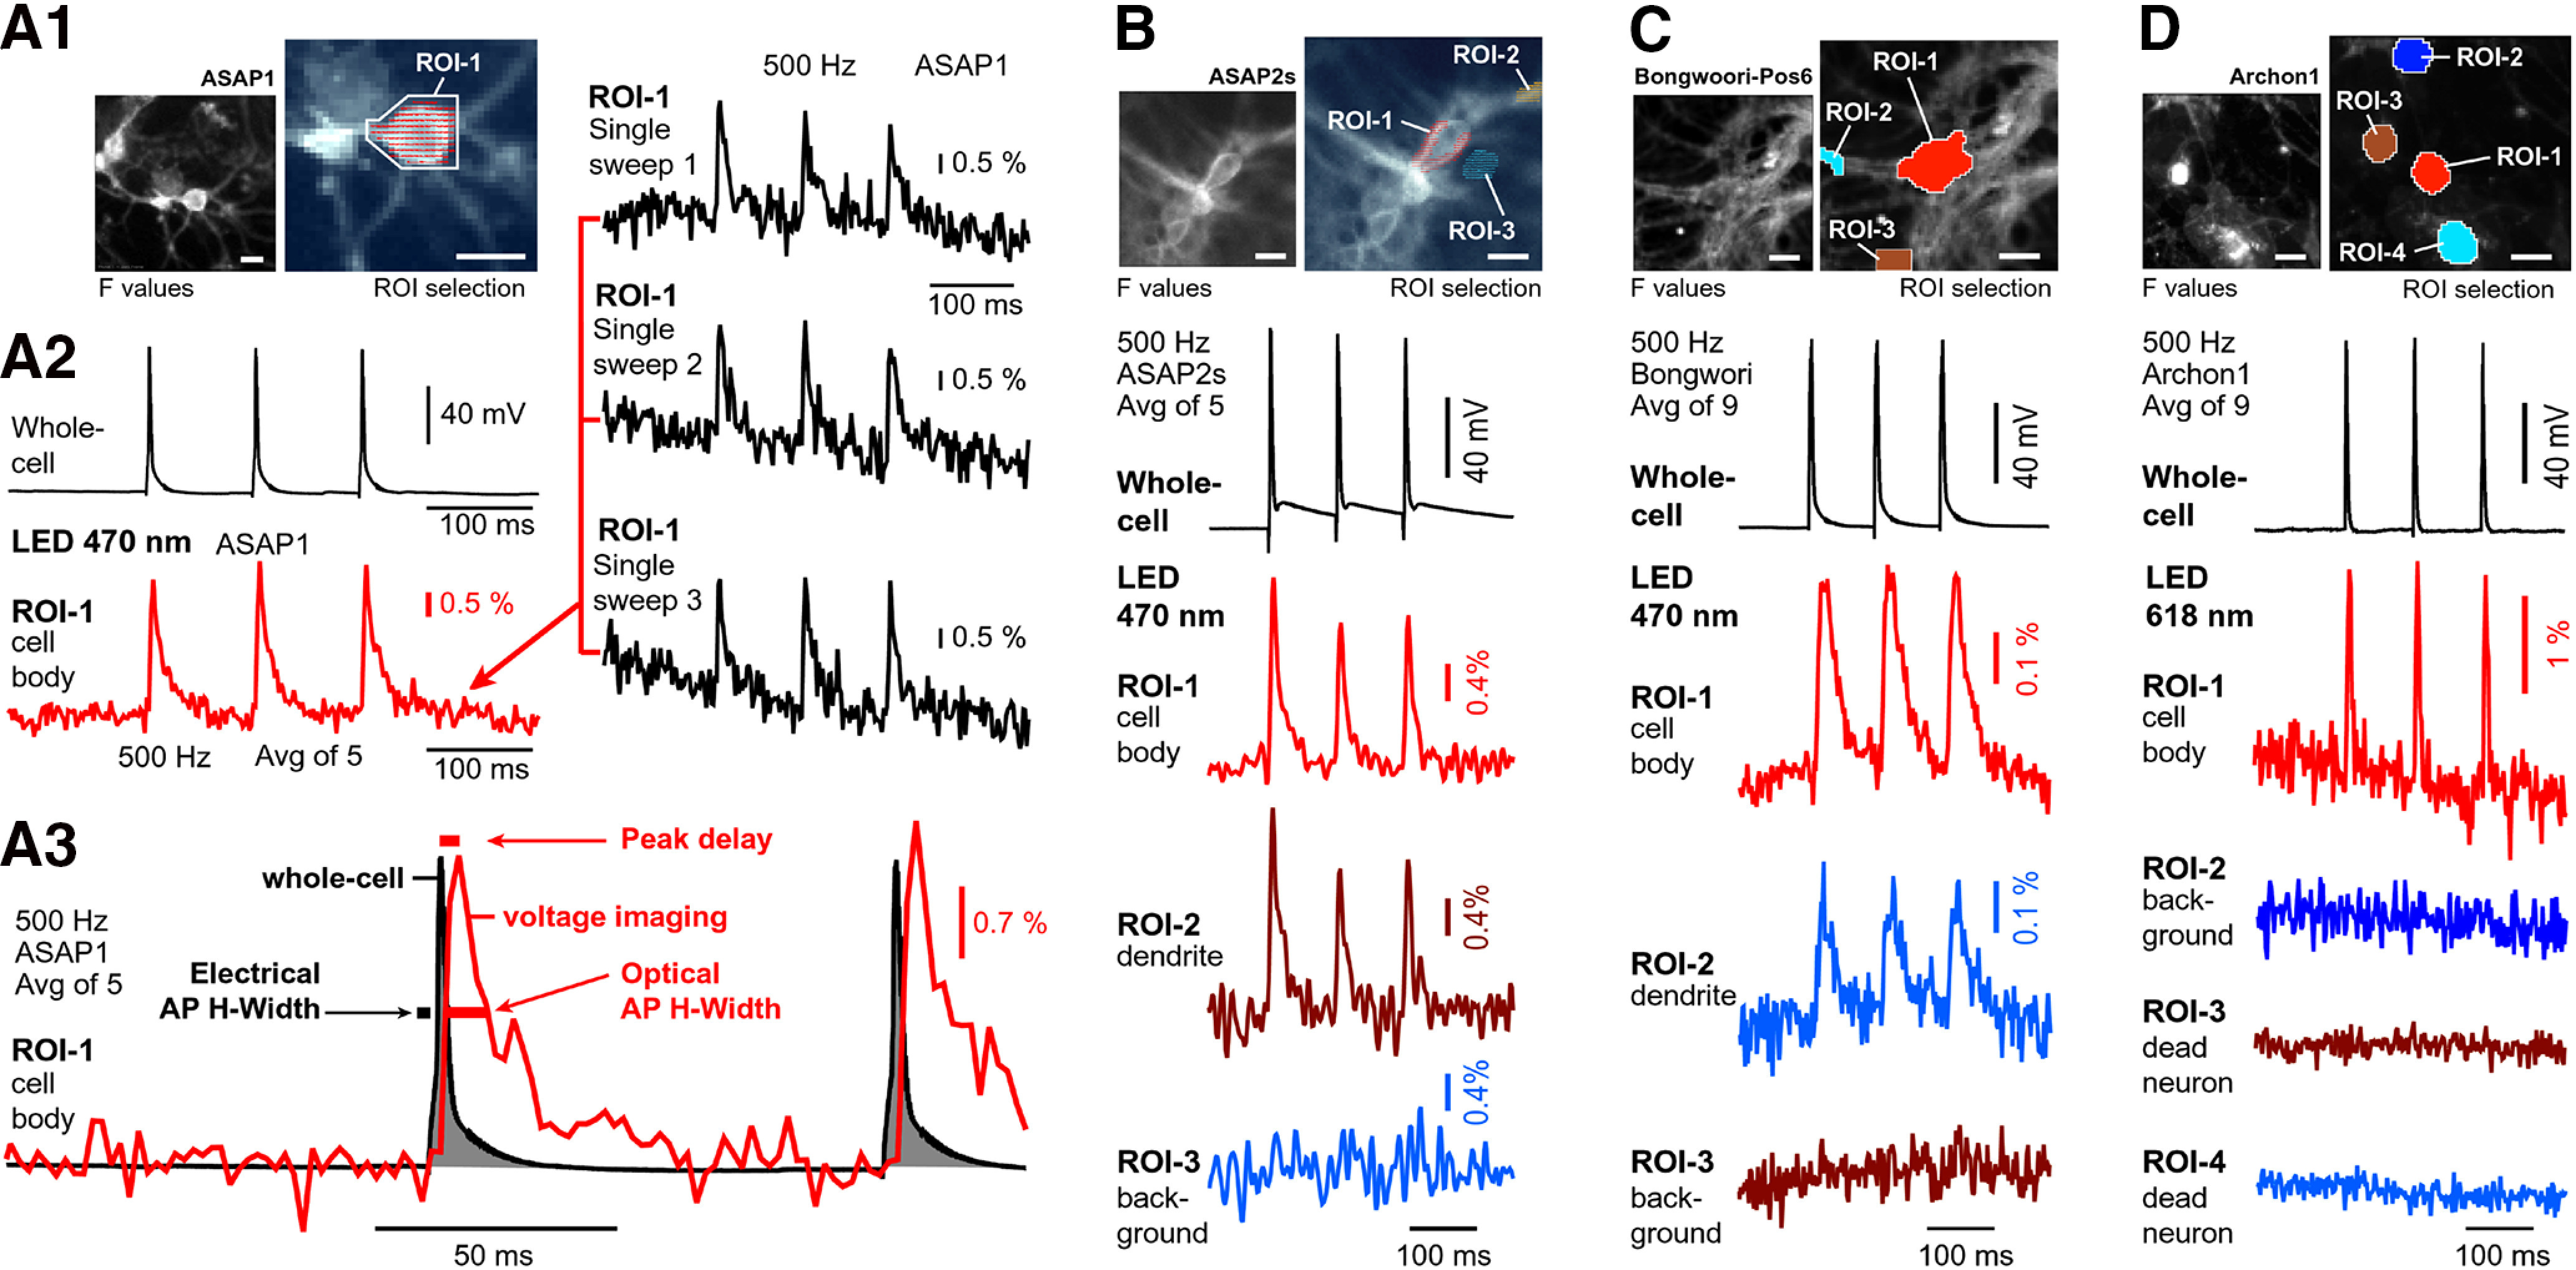
Figure 1.

GEVI imaging in cultured neurons. A1, Right, Fluorescence of primary neuron culture, mouse, DIV22, transduced with pCAG-ASAP1. Left, Image captured by a low-resolution camera during voltage imaging at 500 frames per second. A2, A cell was stimulated via patch electrode to produce three action potentials, while optical signals were recorded from the entire visual field. In data display, one ROI was selected over the cell body of the patched neuron (actual pixels marked by dashes in A1). Red trace shows action potential-associated optical signals after five temporal averaging, but also in single sweeps (black optical traces). A3, Temporal discrepancies between electrical (gray, 16 kHz) and optical (red, 0.5 kHz) recordings: the peak of the optical signal lags behind the peak of the electrical signal (Peak delay). The action potential half-widths are much longer in optical recordings (optical action potential half-width). B, Same as in A1–A3, except different cell (DIV15), different AAV vector (CamK2-ASAP2s), and three ROIs are selected. C, Same as in A–A3, except different cell (DIV28), different AAV (hSyn-Bongwoori-Pos6), nine temporal averaging, and three ROIs are selected. D, Same as in C, except different cell (DIV15), different AAV (hSyn-Archon1), and four ROIs are selected. Scale bars, 10 μm. Imaging conditions for ASAP1, ASAP2, and Bongwoori: excitation filter: 480/40 nm; dichroic filter: 510 nm; and emission filter: 535/50 nm. Light power ASAP1 and ASAP2 = 5.05 mW/mm2; and Bongwoori = 10.1 mW/mm2. Imaging conditions for Archon1: LED: 568 ± 60 nm, 2.7 mW/mm2; excitation filter: 605/30 nm; dichroic filter: 640 nm; long-pass emission filter: 665 nm.
