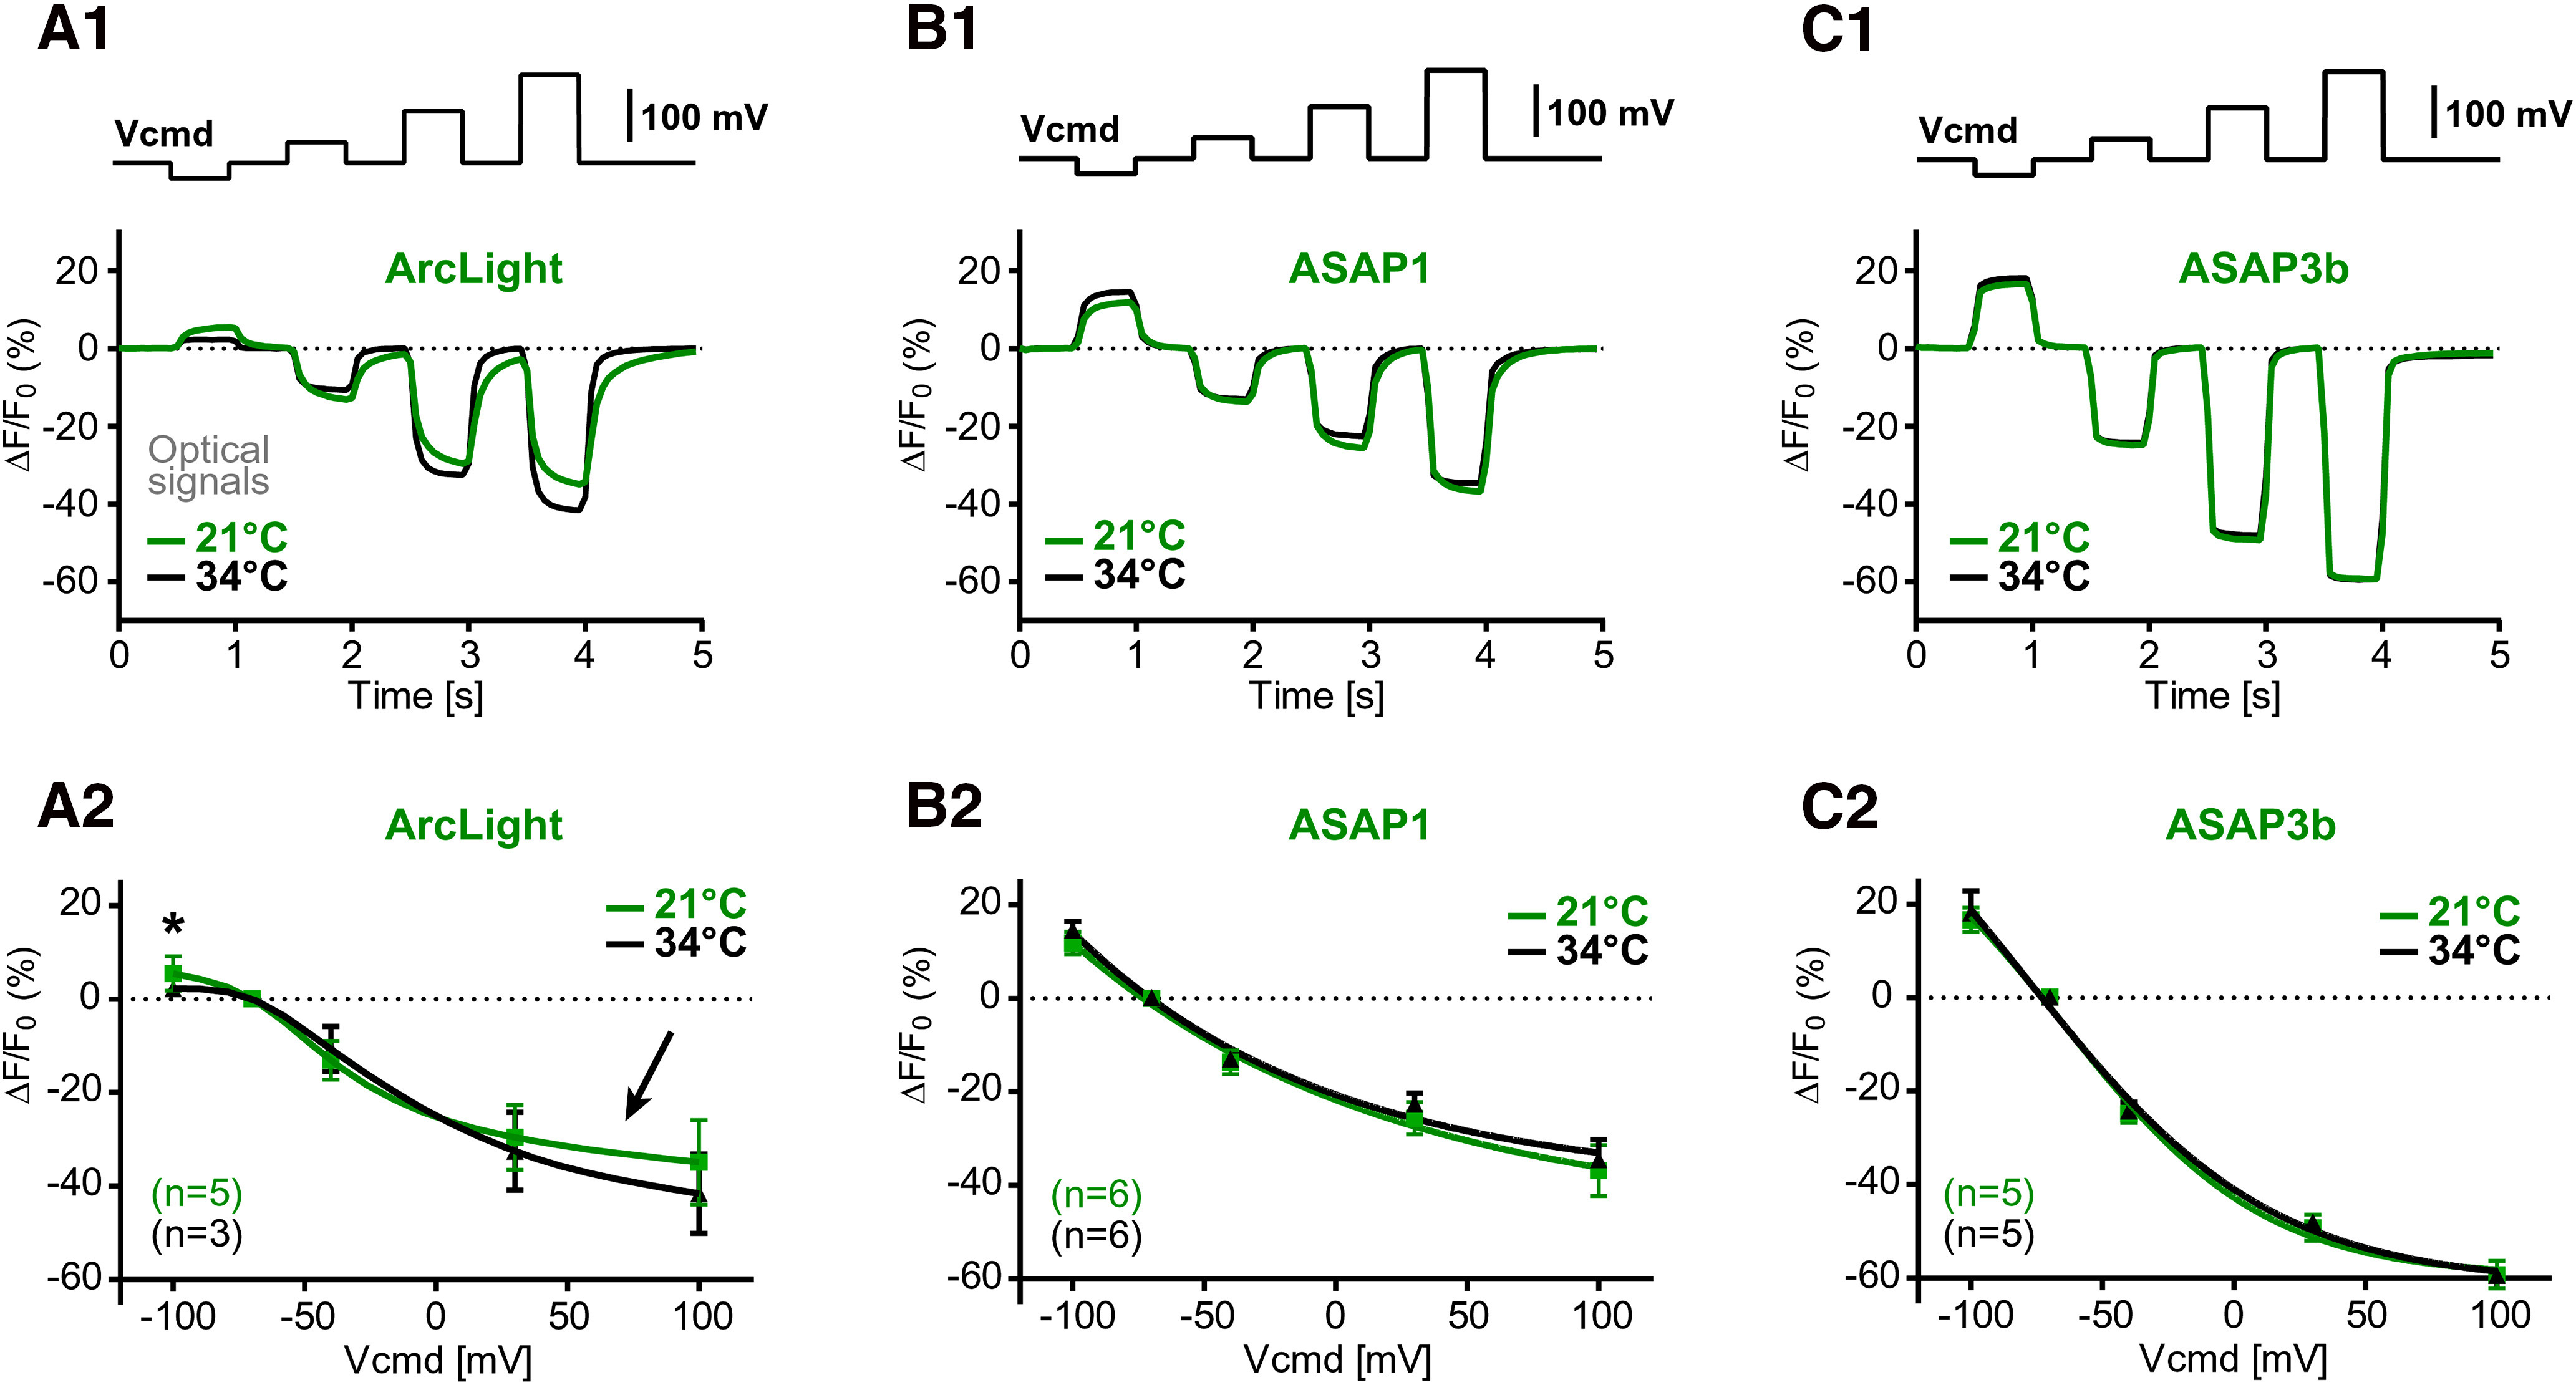
Figure 3.

Temperature sensitivity of the GEVI optical signal. A1, A2, In the same cell, voltage-clamp evoked optical signals were measured at two temperatures (21°C and 34°C). Group data show voltage sensitivity of the optical signal. Each marker is a mean ± SEM. The n value is indicated in the bottom left corner. The trend line is a Boltzmann fit through the markers. An arrow marks the alleged discrepancy between two temperatures. An asterisk marks significant difference (p < 0.05). B1, B2, Same as in A1 and A2, except ASAP1 was tested. C1, C2, Same as in A1 and A2, except ASAP3b was tested.
