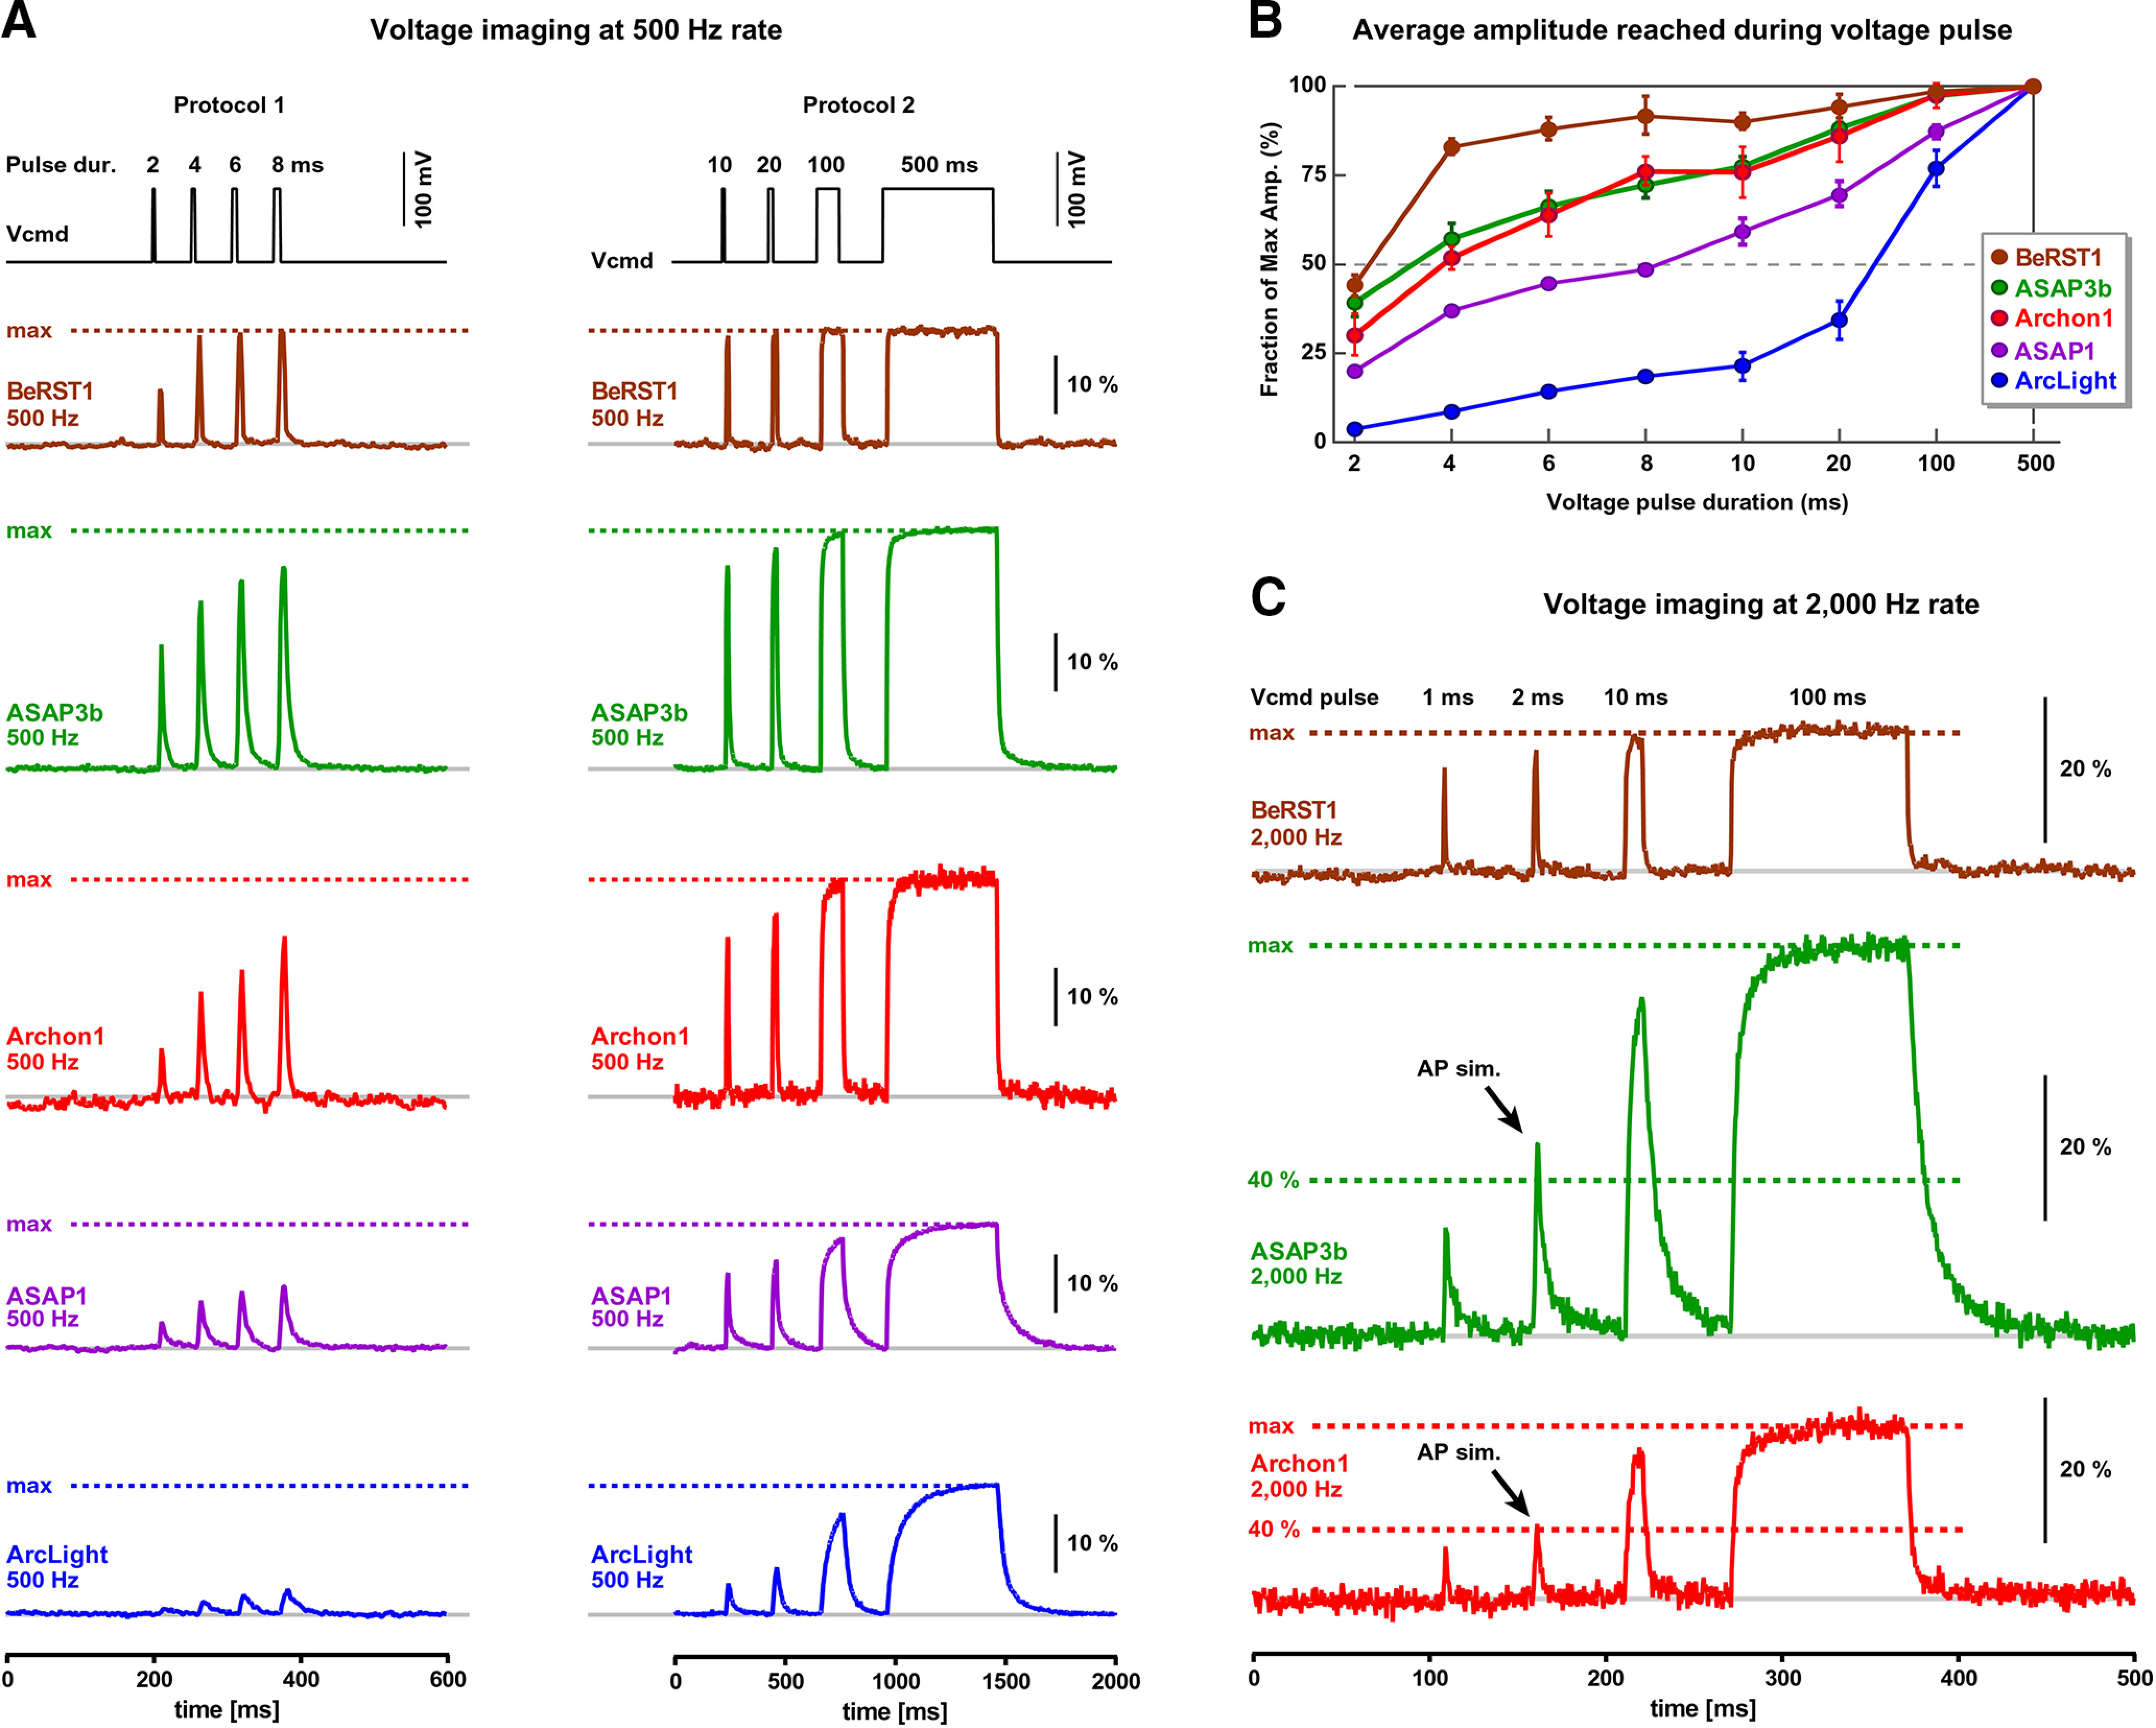
Figure 4.

Temporal dynamics of the GEVI optical response. A, Voltage pulses of the same amplitude (100 mV) but variable duration (2–8 ms, Protocol 1) were applied on HEK cells, while measuring optical signals from the surface of the cell at a 500 Hz frame rate. In Protocol 2, voltage command pulse durations were in the range 10–500 ms. All optical traces are on the same amplitude (ΔF/F) and time scale (ms). Dashed horizontal line indicates steady-state amplitude (max). B, Average amplitude reached per indicator per pulse duration. Before averaging, the amplitudes were normalized using the steady-state amplitude (max) achieved during the 500 ms voltage command pulse in the same cell. The number of cells for ArcLight, ASAP1, Archon1, ASAP3b, and BeRST1 are 4, 6, 2, 6, and 3, respectively. C, Evaluation of the GEVI temporal dynamics using 2000 Hz sampling of optical signals. Vcmd pulse durations are 1, 2, 10, and 100 ms. All optical traces are on the same amplitude (ΔF/F) and time (ms) scale. Steady-state amplitude (100%) and the 40% amplitude levels are marked by horizontal dashed lines to yield the interpretation of the data. AP sim. marks the optical signal responding to a 2-ms-long voltage pulse; “AP sim.” marks a 2 ms voltage pulse, which is similar in duration to a membrane potential transient experienced by the plasma membrane during a real AP.
